AI Database Agents
Version 1No published result

A traceable AI data analyst that turns plain-English database questions into live answers, charts, and saved insights.
Excellent analyst copilot, with one real follow-up caveat.
Anomaly AI is a strong fit for non-technical business users who want live database answers with visible SQL, automatic charts, and saved insights. It is especially strong on traceability and self-checking, but one follow-up chain showed that referents can drift when the same phrase, like "top 3," is reused later in the conversation.
Explore Anomaly AI in our public benchmarks.
No published result
Our detailed analysis of Anomaly AI — features, performance, and real-world testing.
Feature tested: Natural-Language Database Q&A
Result: Passed
Verdict: Strong
Expected behavior: Answers business questions against a live connected database in plain English, returning readable narratives, tables, and summaries without requiring SQL. The proofs exercised live database questions rather than a single fixed query shape.
Test case: Text prompt → Image
Input type: Text prompt
Input used: Input artifact (Text prompt): INPUT
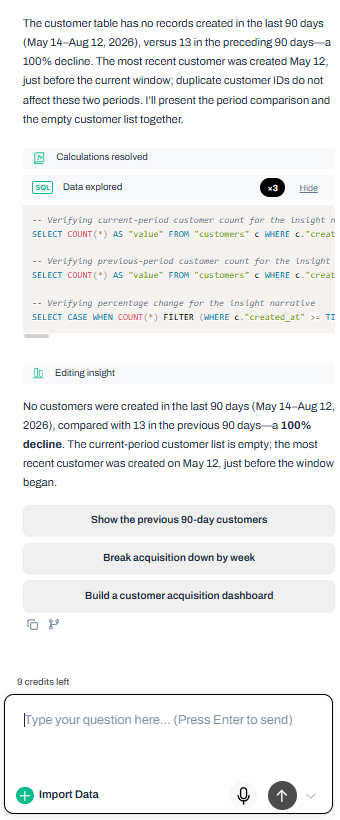
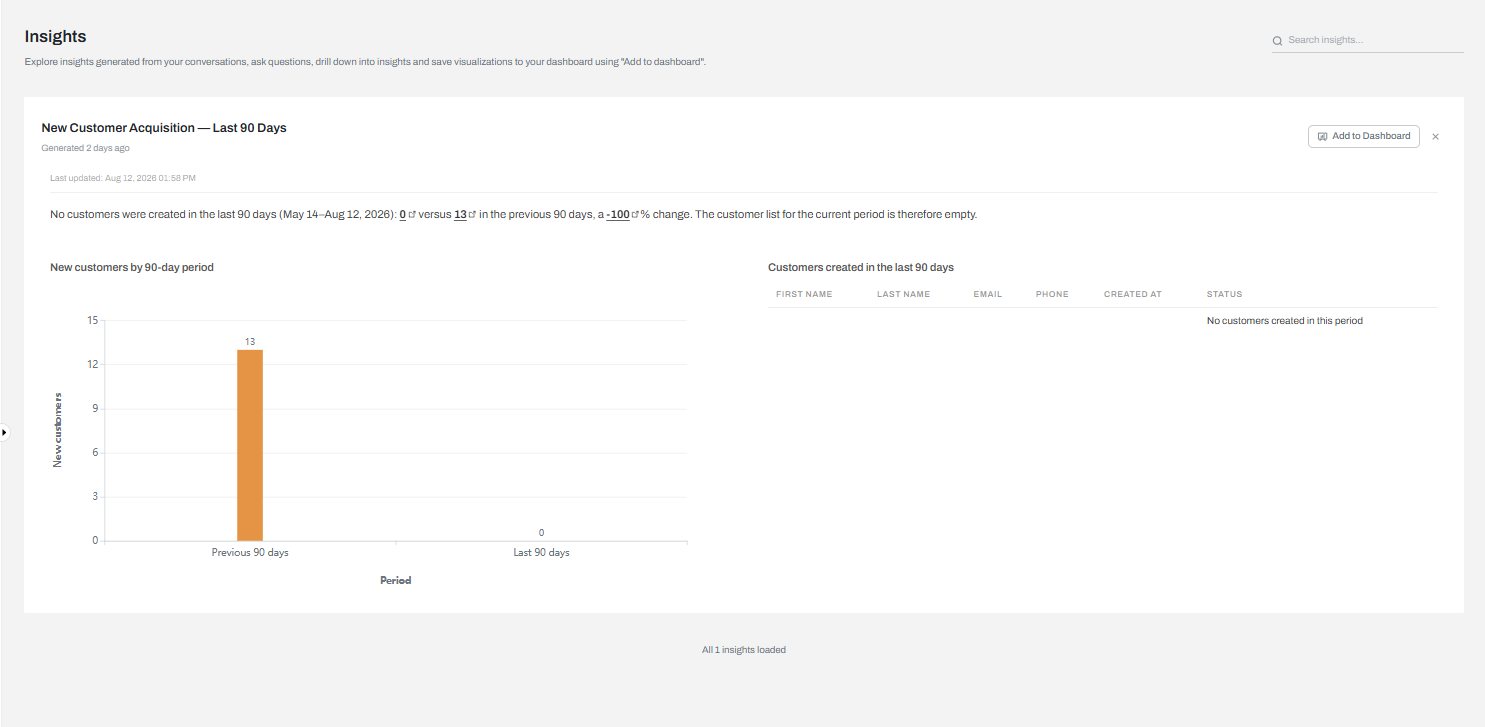
Observed output: Output artifact (Image): Returned a plain-language answer saying no customers were created in the last 90 days versus 13 in the previous 90 days, and showed the empty current-period customer list. — input1-answer-text-and-verification.png
Input artifact: Input artifact (Text prompt): INPUT
Output artifact: Output artifact (Image): Returned a plain-language answer saying no customers were created in the last 90 days versus 13 in the previous 90 days, and showed the empty current-period customer list. — input1-answer-text-and-verification.png
What changed: Text prompt transformed into Image
Test case: Text prompt → Image
Input type: Text prompt
Input used: Input artifact (Text prompt): INPUT
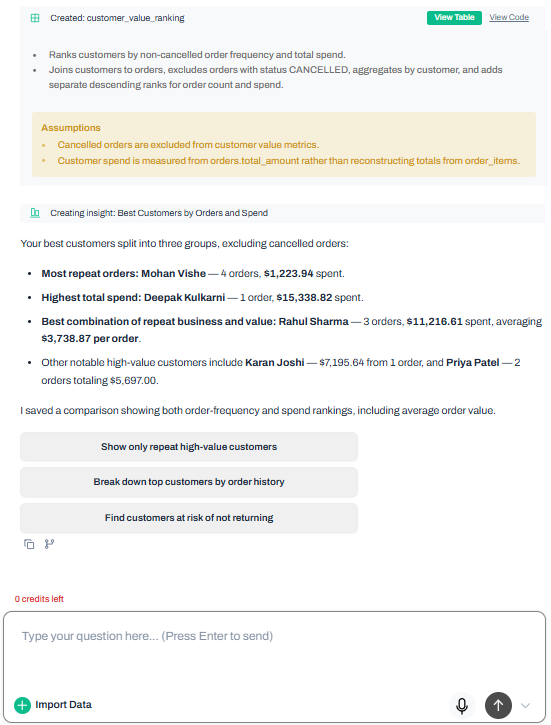
Observed output: Output artifact (Image): Created the reusable customer_value_ranking transformation and spelled out the ranking assumptions. — d3c4dc7e53c64af199ab4b67e54dad75.png
Input artifact: Input artifact (Text prompt): INPUT
Output artifact: Output artifact (Image): Created the reusable customer_value_ranking transformation and spelled out the ranking assumptions. — d3c4dc7e53c64af199ab4b67e54dad75.png
What changed: Text prompt transformed into Image
Test case: Text prompt → Image
Input type: Text prompt
Input used: Input artifact (Text prompt): INPUT
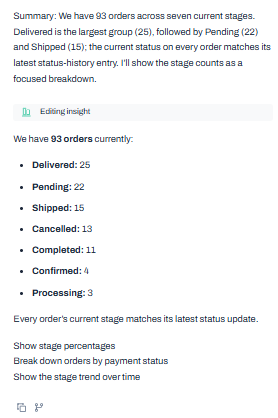
Observed output: Output artifact (Image): Returned a 93-order summary across seven current stages, with the stage counts listed in natural language. — input3-main-summary-and-stage-list.png
Input artifact: Input artifact (Text prompt): INPUT
Output artifact: Output artifact (Image): Returned a 93-order summary across seven current stages, with the stage counts listed in natural language. — input3-main-summary-and-stage-list.png
What changed: Text prompt transformed into Image
Why it matters / Conclusion: Strong across all three tasks; it consistently turned plain-English business questions into correct live-database answers.
Answers business questions against a live connected database in plain English, returning readable narratives, tables, and summaries without requiring SQL. The proofs exercised live database questions rather than a single fixed query shape.
Feature tested: Derived Table Creation and Reuse
Result: Passed
Verdict: Strong
Expected behavior: Creates named derived tables from exploratory analysis and lets later follow-up questions reuse them as persistent analysis assets. The evidence shows one exploratory result being turned into something reusable across later questions.
Test case: Text prompt → Image
Input type: Text prompt
Input used: Input artifact (Text prompt): INPUT
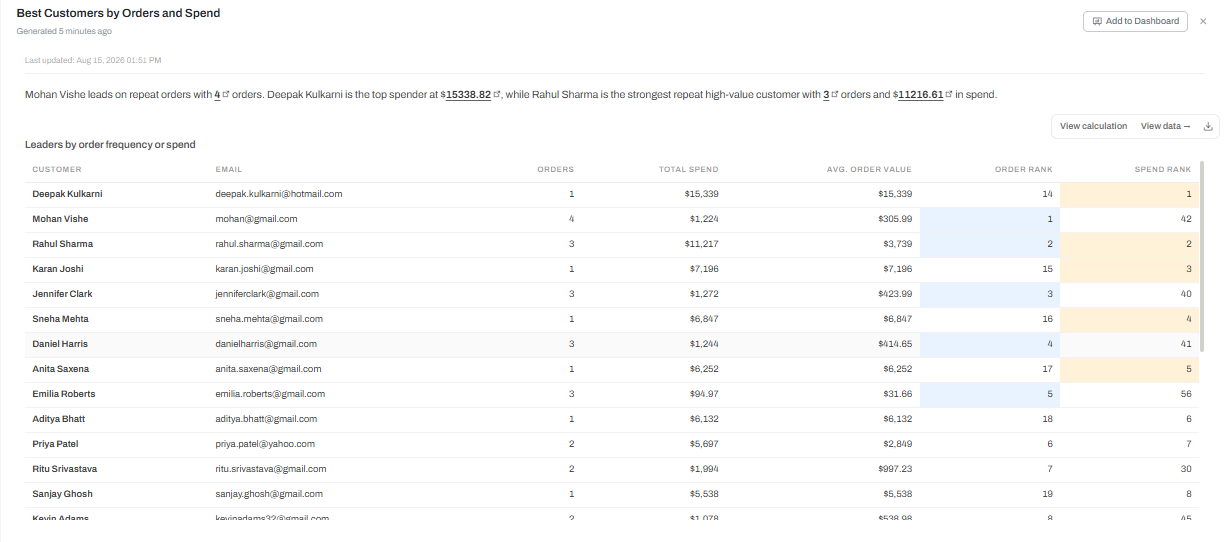
Observed output: Output artifact (Image): Returned a customer ranking table that split the answer into order frequency, total spend, average order value, and separate ranks for both dimensions. — a5acbd76bf834a3f88b1d6461f00f8b7.png
Input artifact: Input artifact (Text prompt): INPUT
Output artifact: Output artifact (Image): Returned a customer ranking table that split the answer into order frequency, total spend, average order value, and separate ranks for both dimensions. — a5acbd76bf834a3f88b1d6461f00f8b7.png
What changed: Text prompt transformed into Image
Test case: Text prompt → Image
Input type: Text prompt
Input used: Input artifact (Text prompt): INPUT
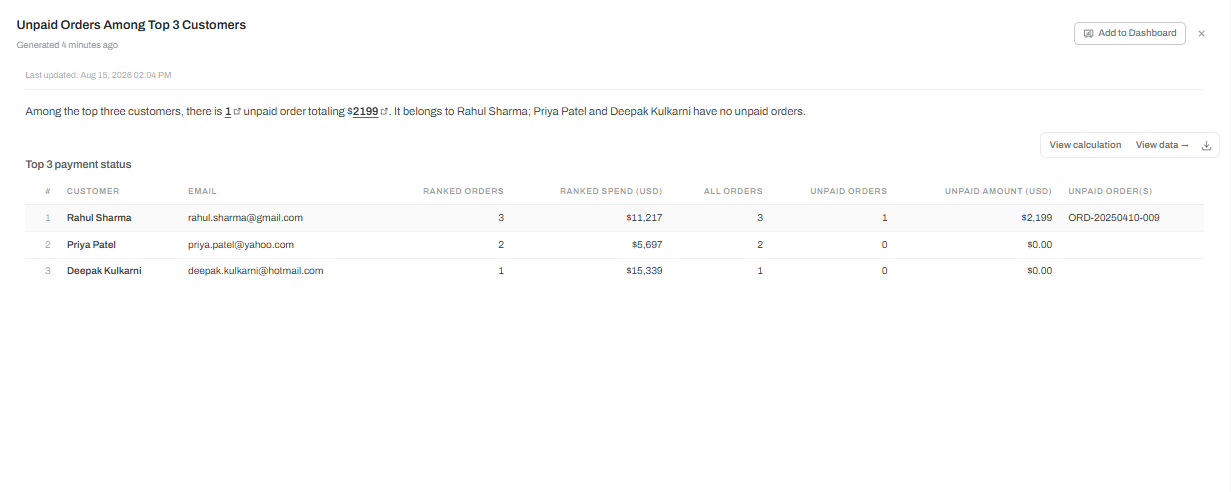
Observed output: Output artifact (Image): Reused the saved ranking context to answer a follow-up about unpaid orders among the selected top three customers. — input2-followup1-insights-top3-payment-status-table.png
Input artifact: Input artifact (Text prompt): INPUT
Output artifact: Output artifact (Image): Reused the saved ranking context to answer a follow-up about unpaid orders among the selected top three customers. — input2-followup1-insights-top3-payment-status-table.png
What changed: Text prompt transformed into Image
Test case: Text prompt → Image
Input type: Text prompt
Input used: Input artifact (Text prompt): INPUT
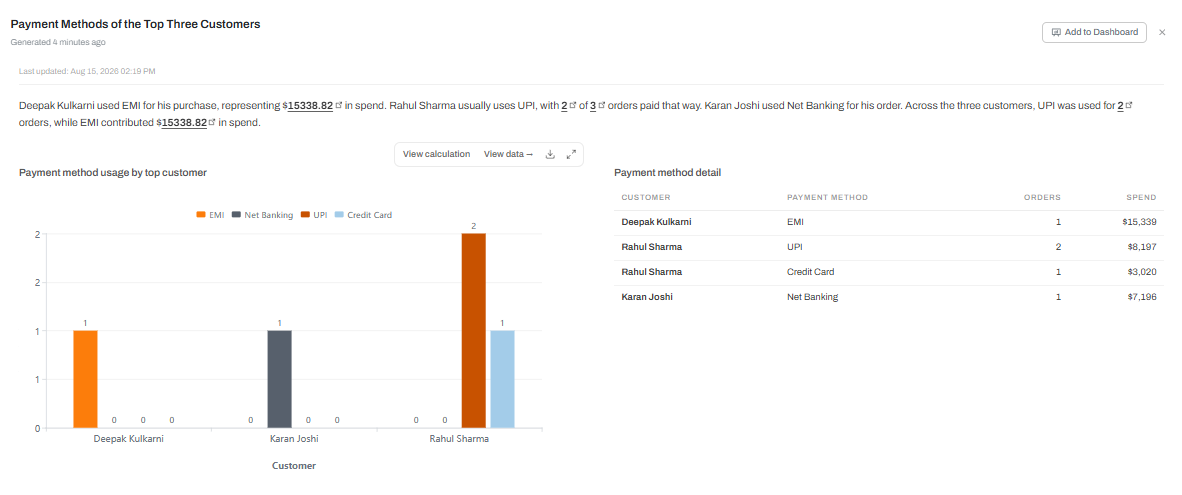
Observed output: Output artifact (Image): Built on the same customer-ranking workflow to summarize payment methods for the selected high-value customers. — input2-followup2-insights-payment-chart-and-table.png
Input artifact: Input artifact (Text prompt): INPUT
Output artifact: Output artifact (Image): Built on the same customer-ranking workflow to summarize payment methods for the selected high-value customers. — input2-followup2-insights-payment-chart-and-table.png
What changed: Text prompt transformed into Image
Why it matters / Conclusion: Strong; it can turn one exploratory result into a reusable analysis object and keep using it in later questions.
Creates named derived tables from exploratory analysis and lets later follow-up questions reuse them as persistent analysis assets. The evidence shows one exploratory result being turned into something reusable across later questions.
Feature tested: Query Transparency and Validation
Result: Passed
Verdict: Strongest
Expected behavior: Shows the generated SQL, explains calculations in plain language, and surfaces validation or integrity checks before publishing an insight. The examples included both human-readable explanations and raw SQL/verification steps.
Test case: Text prompt → Image
Input type: Text prompt
Input used: Input artifact (Text prompt): INPUT
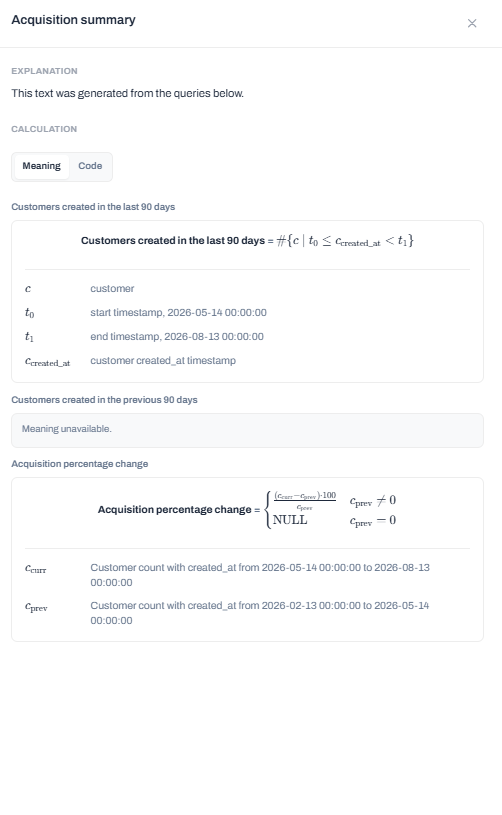
Observed output: Output artifact (Image): The acquisition summary modal explains the calculation in plain mathematical notation on the Meaning tab. — input1-acquisition-summary-meaning-tab.png
Input artifact: Input artifact (Text prompt): INPUT
Output artifact: Output artifact (Image): The acquisition summary modal explains the calculation in plain mathematical notation on the Meaning tab. — input1-acquisition-summary-meaning-tab.png
What changed: Text prompt transformed into Image
Test case: Text prompt → Image
Input type: Text prompt
Input used: Input artifact (Text prompt): INPUT
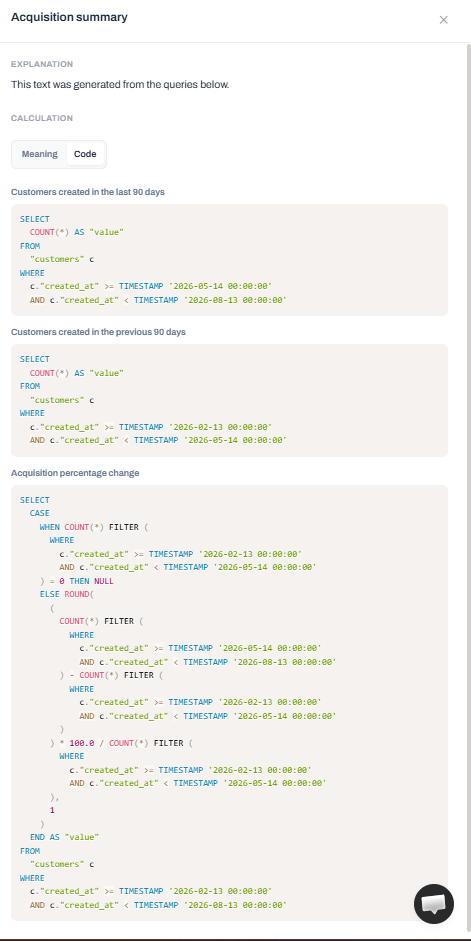
Observed output: Output artifact (Image): The same modal shows the raw SQL for the current and previous 90-day windows and the percentage-change calculation. — input1-acquisition-summary-sql-query-tab.png
Input artifact: Input artifact (Text prompt): INPUT
Output artifact: Output artifact (Image): The same modal shows the raw SQL for the current and previous 90-day windows and the percentage-change calculation. — input1-acquisition-summary-sql-query-tab.png
What changed: Text prompt transformed into Image
Test case: Text prompt → Image
Input type: Text prompt
Input used: Input artifact (Text prompt): INPUT
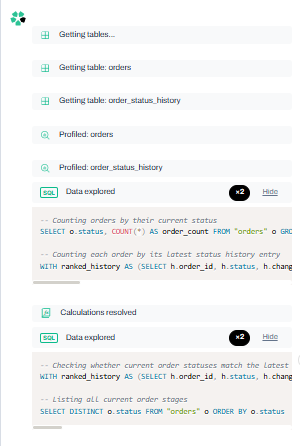
Observed output: Output artifact (Image): The workflow shows SQL exploration plus a validation pass that checks current order status against status history before the summary is published. — input3-main-chat-sql-and-integrity-check.png
Input artifact: Input artifact (Text prompt): INPUT
Output artifact: Output artifact (Image): The workflow shows SQL exploration plus a validation pass that checks current order status against status history before the summary is published. — input3-main-chat-sql-and-integrity-check.png
What changed: Text prompt transformed into Image
Why it matters / Conclusion: This was the strongest explanation surface in the test set: answers were traceable in both business language and raw SQL, with validation shown before publication.
Shows the generated SQL, explains calculations in plain language, and surfaces validation or integrity checks before publishing an insight. The examples included both human-readable explanations and raw SQL/verification steps.
Feature tested: Automated Insight and Chart Generation
Result: Passed
Verdict: Strong
Expected behavior: Automatically turns query results into saved insight cards with relevant charts and tables, without the user designing the visualization first. The tests produced multiple visualization types, including bar, scatter, donut, and table-based outputs.
Test case: Text prompt → Image
Input type: Text prompt
Input used: Input artifact (Text prompt): INPUT
Observed output: Output artifact (Image): Created a persistent acquisition insight with a bar chart and an empty current-period customer table. — input1-insights-auto-dashboard-chart.png
Input artifact: Input artifact (Text prompt): INPUT
Output artifact: Output artifact (Image): Created a persistent acquisition insight with a bar chart and an empty current-period customer table. — input1-insights-auto-dashboard-chart.png
What changed: Text prompt transformed into Image
Test case: Text prompt → Image
Input type: Text prompt
Input used: Input artifact (Text prompt): INPUT
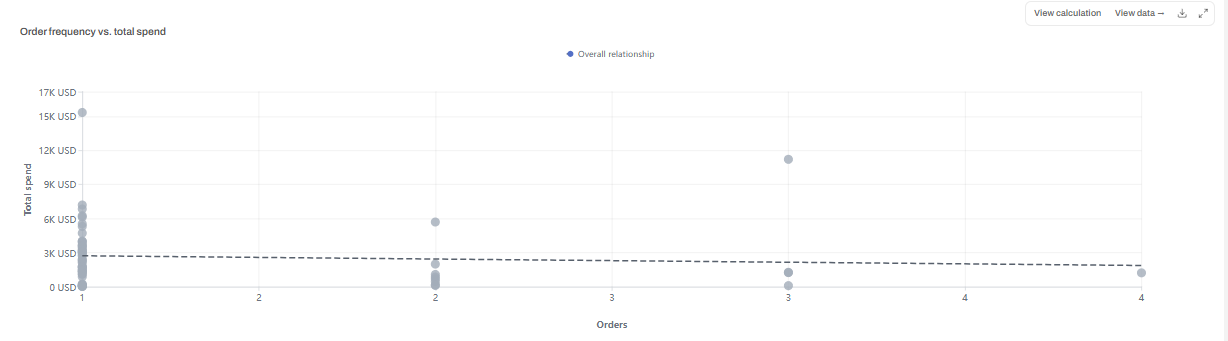
Observed output: Output artifact (Image): Auto-generated a scatter plot of order frequency versus total spend to show how frequency and value relate. — input2-main-scatter-plot-freq-vs-spend.png
Input artifact: Input artifact (Text prompt): INPUT
Output artifact: Output artifact (Image): Auto-generated a scatter plot of order frequency versus total spend to show how frequency and value relate. — input2-main-scatter-plot-freq-vs-spend.png
What changed: Text prompt transformed into Image
Test case: Text prompt → Image
Input type: Text prompt
Input used: Input artifact (Text prompt): INPUT
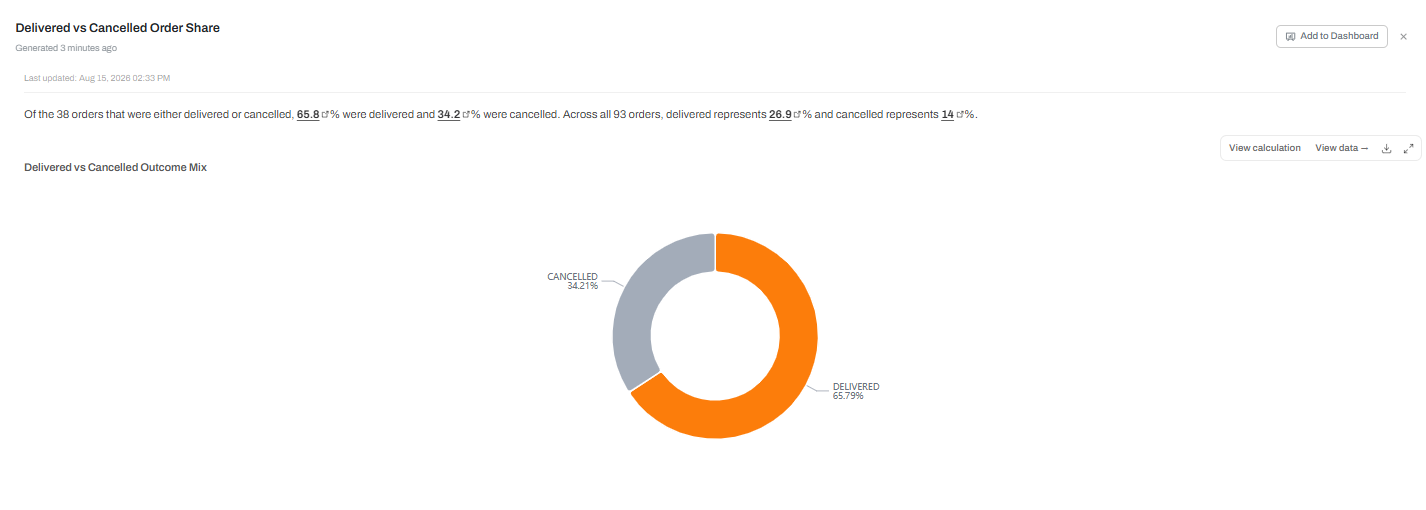
Observed output: Output artifact (Image): Produced a donut chart for delivered versus cancelled order share, with both the subset split and the share of all orders explained. — input3-followup1-insights-donut-chart.png
Input artifact: Input artifact (Text prompt): INPUT
Output artifact: Output artifact (Image): Produced a donut chart for delivered versus cancelled order share, with both the subset split and the share of all orders explained. — input3-followup1-insights-donut-chart.png
What changed: Text prompt transformed into Image
Test case: Text prompt → Image
Input type: Text prompt
Input used: Input artifact (Text prompt): INPUT
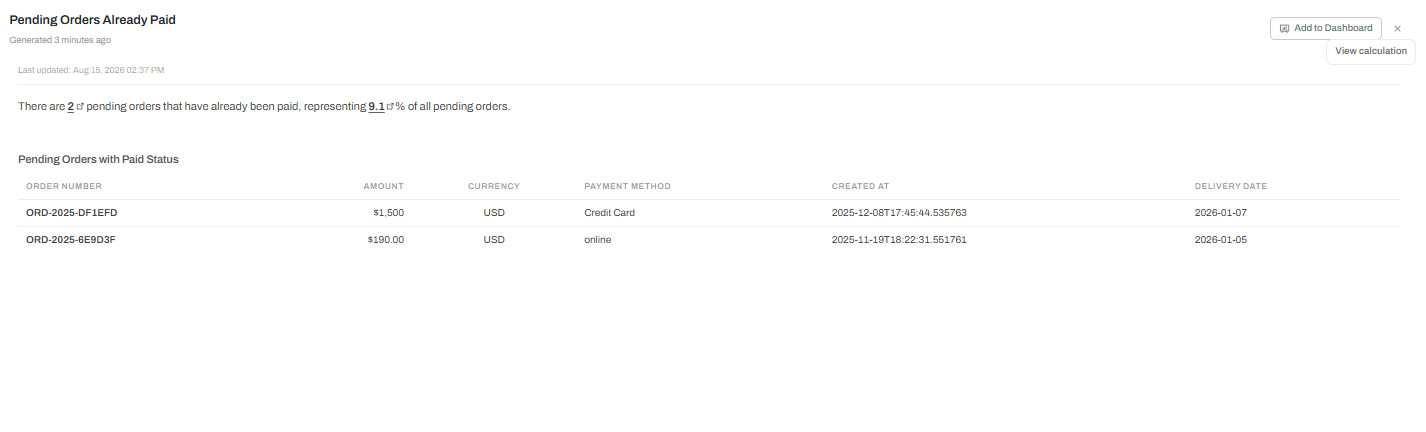
Observed output: Output artifact (Image): Created a saved insight table for the two pending-but-paid orders and included delivery dates in the output. — input3-followup2-insights-table-with-delivery-dates.png
Input artifact: Input artifact (Text prompt): INPUT
Output artifact: Output artifact (Image): Created a saved insight table for the two pending-but-paid orders and included delivery dates in the output. — input3-followup2-insights-table-with-delivery-dates.png
What changed: Text prompt transformed into Image
Why it matters / Conclusion: Strong; the tool consistently picked the right visual for each question and saved the result as a reusable insight.
Automatically turns query results into saved insight cards with relevant charts and tables, without the user designing the visualization first. The tests produced multiple visualization types, including bar, scatter, donut, and table-based outputs.
Feature tested: Threaded Conversational Analysis
Result: Partial
Verdict: Mixed
Expected behavior: Supports follow-up questions that build on earlier results and maintains conversational context across a thread. The evidence covered multi-turn analysis chains, including cases with referent drift in one thread.
Test case: Text prompt → Image
Input type: Text prompt
Input used: Input artifact (Text prompt): INPUT
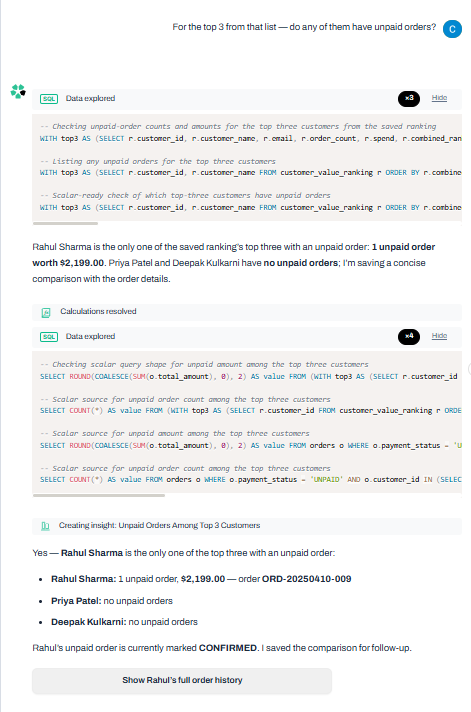
Observed output: Output artifact (Image): Answered the first follow-up using the saved ranking context and showed one unpaid order for Rahul Sharma. — input2-followup1-chat-unpaid-answer.png
Input artifact: Input artifact (Text prompt): INPUT
Output artifact: Output artifact (Image): Answered the first follow-up using the saved ranking context and showed one unpaid order for Rahul Sharma. — input2-followup1-chat-unpaid-answer.png
What changed: Text prompt transformed into Image
Test case: Text prompt → Image
Input type: Text prompt
Input used: Input artifact (Text prompt): INPUT
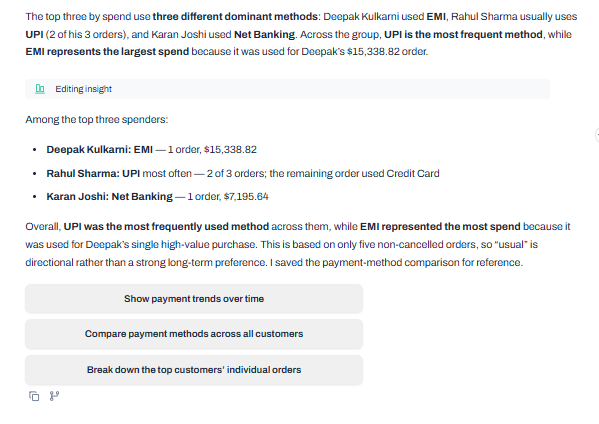
Observed output: Output artifact (Image): Answered the next follow-up with payment-method breakdowns, but the referenced 'top 3' set had shifted to a different trio. — input2-followup2-chat-payment-methods.png
Input artifact: Input artifact (Text prompt): INPUT
Output artifact: Output artifact (Image): Answered the next follow-up with payment-method breakdowns, but the referenced 'top 3' set had shifted to a different trio. — input2-followup2-chat-payment-methods.png
What changed: Text prompt transformed into Image
Test case: Text prompt → Image
Input type: Text prompt
Input used: Input artifact (Text prompt): INPUT
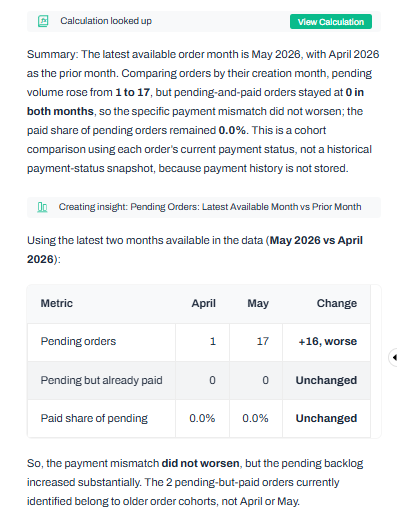
Observed output: Output artifact (Image): Handled the month-over-month follow-up by comparing April and May 2026 while preserving the pending-versus-paid breakdown. — input3-followup3-chat-cohort-comparison.png
Input artifact: Input artifact (Text prompt): INPUT
Output artifact: Output artifact (Image): Handled the month-over-month follow-up by comparing April and May 2026 while preserving the pending-versus-paid breakdown. — input3-followup3-chat-cohort-comparison.png
What changed: Text prompt transformed into Image
Why it matters / Conclusion: Mixed: follow-up analysis is often solid, but the best-customers chain showed a real referent drift when the same phrase was reused.
Supports follow-up questions that build on earlier results and maintains conversational context across a thread. The evidence covered multi-turn analysis chains, including cases with referent drift in one thread.
Monthly billing shown in the screenshot.
Independent rankings where Anomaly AI was tested and rated.
How the embed badge will look on your site

Copy this code to your website source
Discover more AI tools like Anomaly AI to enhance your workflow.
If you are looking to build a custom AI data analyst, natural language analytics, or dashboard insights system for your business or internal workflow, email us at contact@futuresmart.ai.
Found something inaccurate or missing? We try to keep our AI research accurate and useful. If you found outdated information, an issue, or have a suggestion, email us at collaborate@aidemos.com.