Draxlr Review: SQL-backed tables, charts, and CSV exports (2026)
AI Data Analyst · NL2SQL · Data Visualization · June 2026
Our Take
- You want strong SQL generation from plain English database questions.
- You need generated SQL to be visible and easy to verify.
- You want multiple visualization formats for exploring the same result.
- You want a very simple chat-first experience with minimal data exploration.
Feature scores on this page: 8.2/10 (8 scored features)
Our take
Draxlr is strongest when the user needs SQL-backed tables, visible SQL, CSV export, saved queries, dashboard actions, and multiple visualization formats. It generated strong SQL across the tested workflows and handled follow-up context well. The main limitation is that Draxlr feels more like a SQL and data exploration tool than a fully guided conversational analyst. It works best for users who are comfortable reviewing tables, SQL, and chart options, while tools like AskYourDatabase and Basedash feel simpler for non-technical business users. Across the tested workflows, Draxlr was strongest when the question had a clear SQL path, such as acquisition comparison, customer ranking, and order-stage breakdowns. This makes Draxlr feel stronger for SQL-backed exploration than for fully guided business interpretation.
In-Depth Review
Our detailed analysis of Draxlr — features, performance, and real-world testing.
Feature-by-Feature Breakdown
NL2SQL GenerationStrong — understands plain English business questions and converts them into structured SQL-backed outputs.8.5/10▾
Feature tested: NL2SQL Generation
Result: Passed (8.5/10)
Verdict: Strong — understands plain English business questions and converts them into structured SQL-backed outputs.
Expected behavior: Converts plain English database questions into SQL queries, with a generated title and short explanation before showing the result.
Test case: Text prompt → Image
Input type: Text prompt
Input used: Input artifact (Text prompt): Input
Observed output: Output artifact (Image): Draxlr correctly understood the customer acquisition comparison and generated a SQL query using period-based logic. It returned: * Current period customers: 13 — nl2sql_generation.png
Input artifact: Input artifact (Text prompt): Input
Output artifact: Output artifact (Image): Draxlr correctly understood the customer acquisition comparison and generated a SQL query using period-based logic. It returned: * Current period customers: 13 — nl2sql_generation.png
What changed: Text prompt transformed into Image
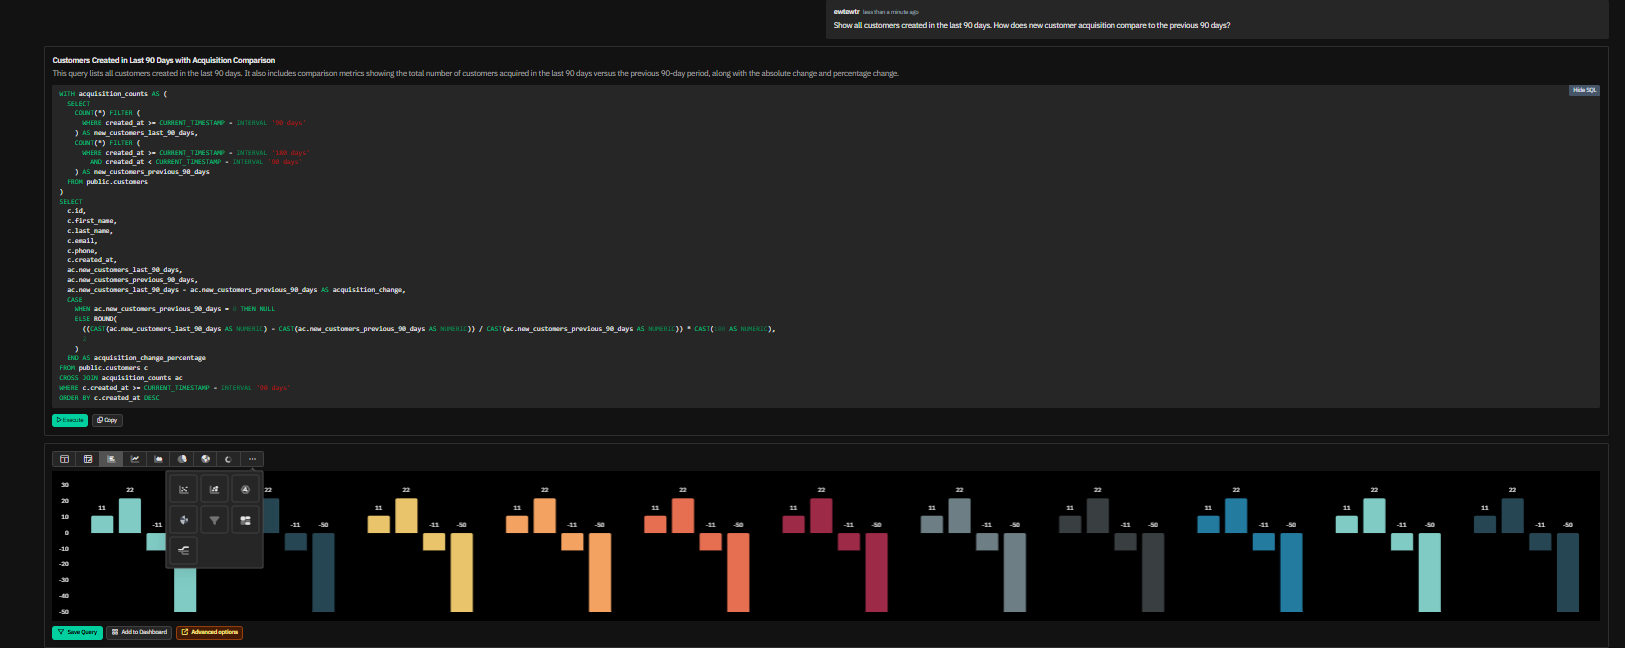
Why it matters / Conclusion: The screenshot is the key proof here. Check whether the natural-language question, generated result title, SQL-backed table, and acquisition comparison numbers appear together in the same output.
Converts plain English database questions into SQL queries, with a generated title and short explanation before showing the result.
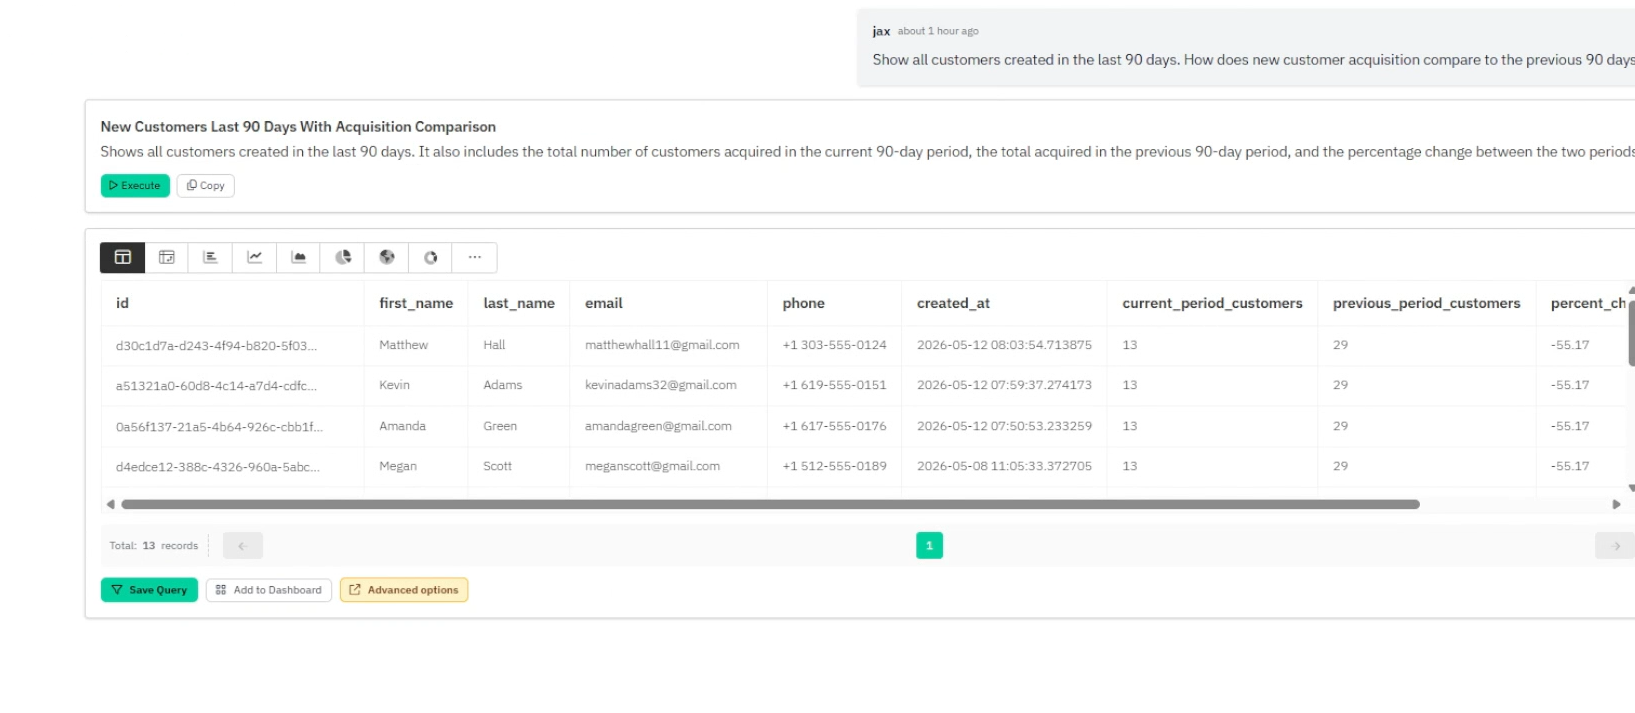
Draxlr correctly understood the customer acquisition comparison and generated a SQL query using period-based logic. It returned: * Current period customers: 13 * Previous period customers: 29 * Difference: -16 customers * Percentage change: -55.17% It also generated a descriptive title and explained what the query was calculating before showing the result.
SQL VisibilityExcellent — SQL is visible by default and the generated queries use strong SQL patterns.9/10▾
Feature tested: SQL Visibility
Result: Passed (9/10)
Verdict: Excellent — SQL is visible by default and the generated queries use strong SQL patterns.
Expected behavior: Shows generated SQL directly in the result flow and uses advanced SQL logic like CTEs, filters, window functions, null safety, and percentage calculations.
Test case: Text prompt → Image
Input type: Text prompt
Input used: Input artifact (Text prompt): Input
Observed output: Output artifact (Image): Draxlr generated SQL to rank customers using order count and total spend. The result included: * customer details * total orders * total spent * average order v — draxlr-sql-visibility.png
Input artifact: Input artifact (Text prompt): Input
Output artifact: Output artifact (Image): Draxlr generated SQL to rank customers using order count and total spend. The result included: * customer details * total orders * total spent * average order v — draxlr-sql-visibility.png
What changed: Text prompt transformed into Image
Why it matters / Conclusion: The screenshot is needed to verify the exact SQL shape Draxlr generated, including how the query logic appears beside the result table instead of being hidden behind the answer.
Shows generated SQL directly in the result flow and uses advanced SQL logic like CTEs, filters, window functions, null safety, and percentage calculations.
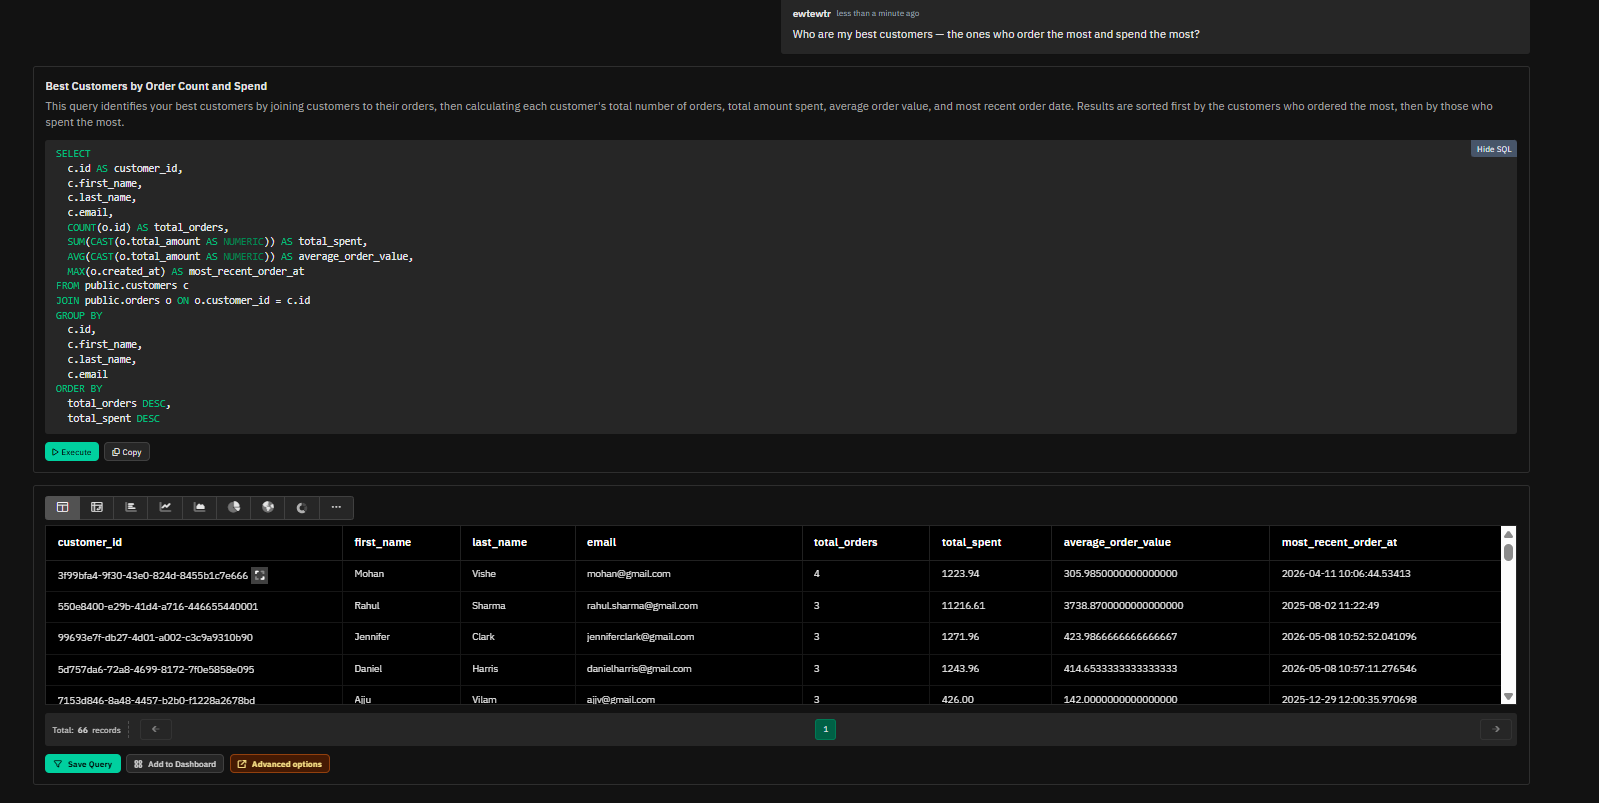
Draxlr generated SQL to rank customers using order count and total spend. The result included: * customer details * total orders * total spent * average order value * most recent order date The output returned 66 records and used structured SQL logic for ranking and aggregation.
Multi-Turn Query ContextStrong — follow-up questions stayed connected to the previous query context.8.5/10▾
Feature tested: Multi-Turn Query Context
Result: Passed (8.5/10)
Verdict: Strong — follow-up questions stayed connected to the previous query context.
Expected behavior: Maintains context across multi-turn database questions and uses previous results correctly in follow-up queries.
Test case: Text prompt → Image
Input type: Text prompt
Input used: Input artifact (Text prompt): Input
Observed output: Output artifact (Image): Draxlr kept the top customer context from the previous query and checked unpaid orders only for those selected customers. It returned: * Vikram Singh — no unpai — draxlr-multi-turn-query-context-1.png
Input artifact: Input artifact (Text prompt): Input
Output artifact: Output artifact (Image): Draxlr kept the top customer context from the previous query and checked unpaid orders only for those selected customers. It returned: * Vikram Singh — no unpai — draxlr-multi-turn-query-context-1.png
What changed: Text prompt transformed into Image
Test case: Text prompt → Image
Input type: Text prompt
Input used: Input artifact (Text prompt): Input
Observed output: Output artifact (Image): Draxlr reused the same top 3 customer context and returned payment method usage. It identified: * Vikram Singh — EMI, 100% * Rahul Sharma — UPI, 66.67%; Credit — draxlr-multi-turn-query-context-2.png
Input artifact: Input artifact (Text prompt): Input
Output artifact: Output artifact (Image): Draxlr reused the same top 3 customer context and returned payment method usage. It identified: * Vikram Singh — EMI, 100% * Rahul Sharma — UPI, 66.67%; Credit — draxlr-multi-turn-query-context-2.png
What changed: Text prompt transformed into Image
Why it matters / Conclusion: The proof depends on comparing the follow-up screenshots. Check whether the same “top 3 customers” context stays intact across the unpaid-order and payment-method follow-ups.
Maintains context across multi-turn database questions and uses previous results correctly in follow-up queries.
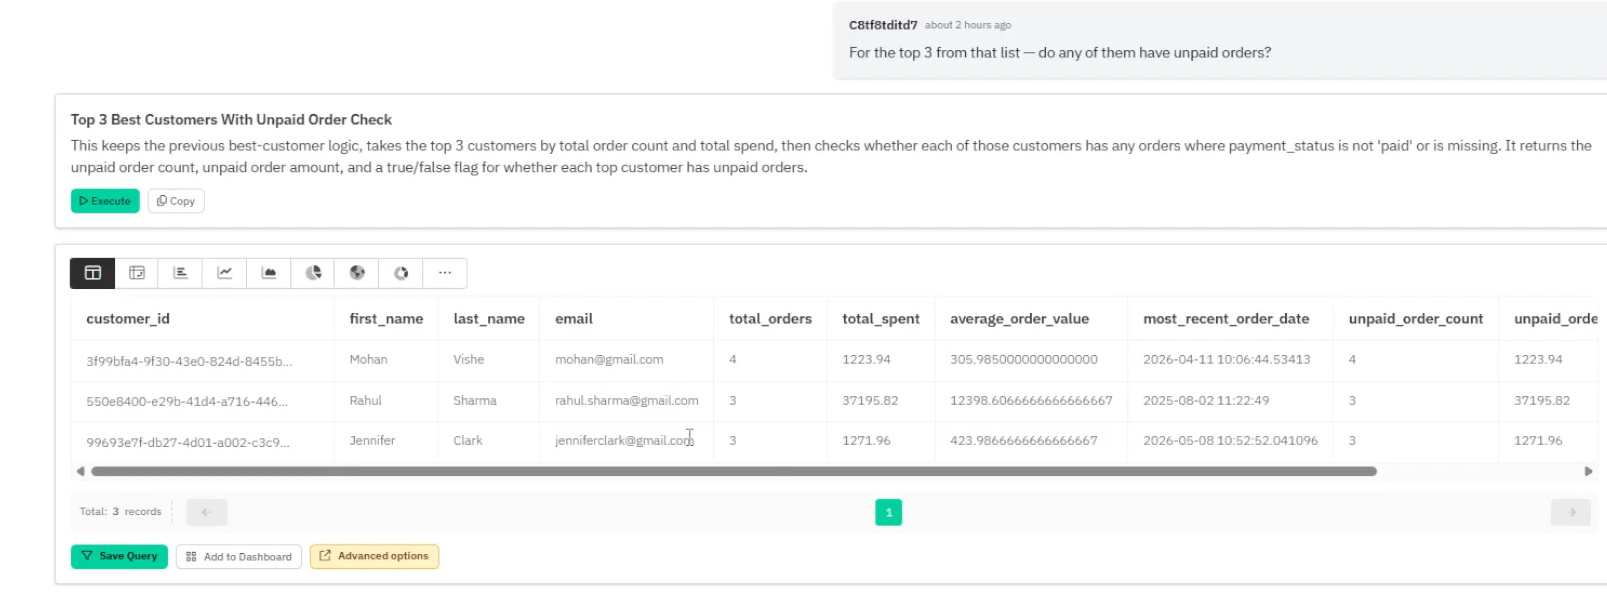
Draxlr kept the top customer context from the previous query and checked unpaid orders only for those selected customers. It returned: * Vikram Singh — no unpaid orders * Rahul Sharma — 1 unpaid order worth 2199.00 * Harish Menon — no unpaid orders
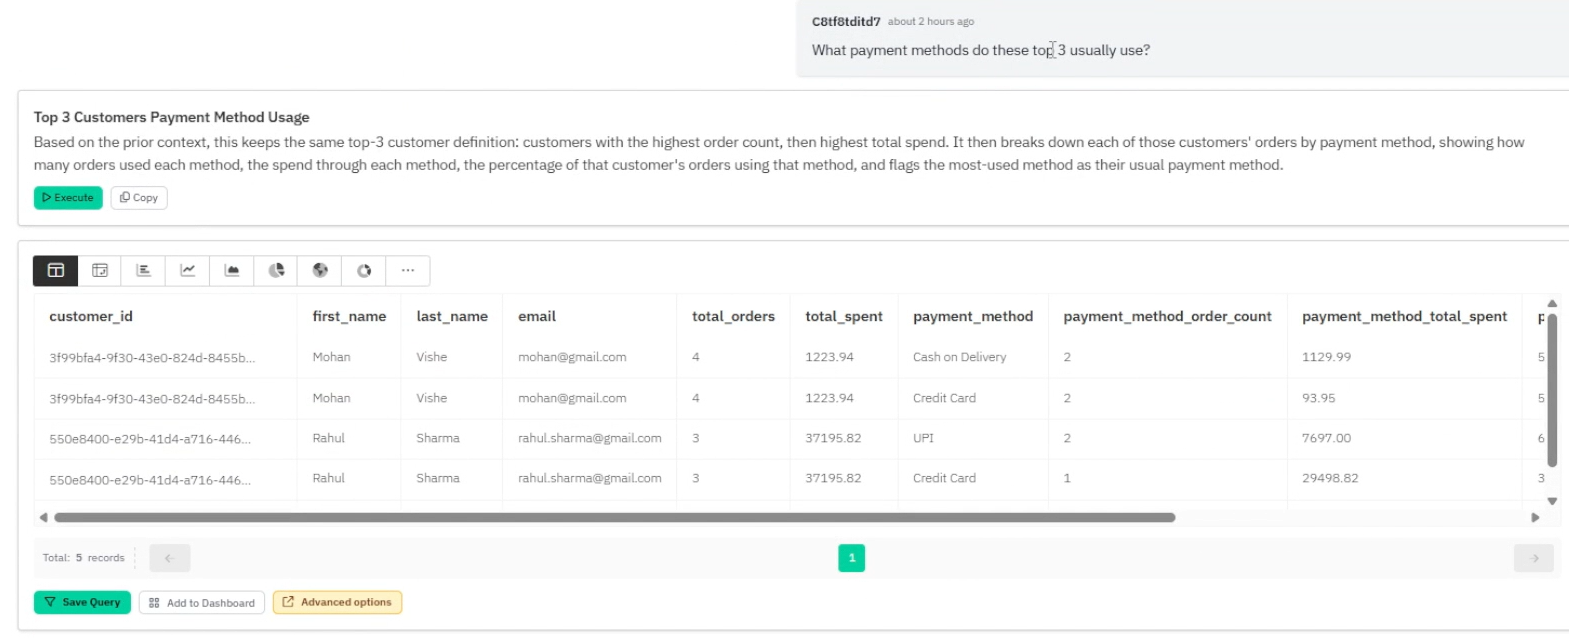
Draxlr reused the same top 3 customer context and returned payment method usage. It identified: * Vikram Singh — EMI, 100% * Rahul Sharma — UPI, 66.67%; Credit Card, 33.33% * Harish Menon — Credit Card, 100% It also added an is_usual_payment_method column to identify the primary payment method.
Data Visualization SwitchingStrong — Draxlr supports multiple visualization formats for exploring the same query result.8/10▾
Feature tested: Data Visualization Switching
Result: Passed (8/10)
Verdict: Strong — Draxlr supports multiple visualization formats for exploring the same query result.
Expected behavior: Draxlr lets users view query results in multiple formats such as table, pivot table, bar chart, line chart, area chart, pie chart, donut chart, scatter plot, radar chart, and tree map.
Test case: Text prompt → Image
Input type: Text prompt
Input used: Input artifact (Text prompt): Input
Observed output: Output artifact (Image): Draxlr returned the result in a table and also provided multiple visualization options for exploring the same data. The available visualization formats included — draxlr-data-visualization-switching.png
Input artifact: Input artifact (Text prompt): Input
Output artifact: Output artifact (Image): Draxlr returned the result in a table and also provided multiple visualization options for exploring the same data. The available visualization formats included — draxlr-data-visualization-switching.png
What changed: Text prompt transformed into Image
Why it matters / Conclusion: The screenshot is the only place to verify the actual chart picker. Check which table and chart formats are visible around the result set inside Draxlr’s interface.
Draxlr lets users view query results in multiple formats such as table, pivot table, bar chart, line chart, area chart, pie chart, donut chart, scatter plot, radar chart, and tree map.
Draxlr returned the result in a table and also provided multiple visualization options for exploring the same data. The available visualization formats included: * Table * Pivot Table * Bar Chart * Line Chart * Area Chart * Pie Chart * Donut Chart * Scatter Plot * Radar Chart * Tree Map
AI Summary / Result ExplanationGood — Draxlr can generate readable AI summaries for SQL-backed result tables.7.5/10▾
Feature tested: AI Summary / Result Explanation
Result: Partial (7.5/10)
Verdict: Good — Draxlr can generate readable AI summaries for SQL-backed result tables.
Expected behavior: Draxlr can add short AI summaries below result tables to help users understand SQL-backed outputs in plain English.
Test case: Text prompt → Image
Input type: Text prompt
Input used: Input artifact (Text prompt): Input
Observed output: Output artifact (Image): Draxlr returned the order stage table and generated an AI Summary. The summary explained the order distribution across stages, including delivered, pending, shi — draxlr-ai-summary-1.png
Input artifact: Input artifact (Text prompt): Input
Output artifact: Output artifact (Image): Draxlr returned the order stage table and generated an AI Summary. The summary explained the order distribution across stages, including delivered, pending, shi — draxlr-ai-summary-1.png
What changed: Text prompt transformed into Image
Test case: Text prompt → Image
Input type: Text prompt
Input used: Input artifact (Text prompt): Input
Observed output: Output artifact (Image): Draxlr returned the delivered vs cancelled percentage and generated a readable AI Summary. The summary highlighted the delivered and cancelled order percentages — draxlr-ai-summary-2.png
Input artifact: Input artifact (Text prompt): Input
Output artifact: Output artifact (Image): Draxlr returned the delivered vs cancelled percentage and generated a readable AI Summary. The summary highlighted the delivered and cancelled order percentages — draxlr-ai-summary-2.png
What changed: Text prompt transformed into Image
Why it matters / Conclusion: The screenshot is needed to verify where the AI Summary appears in the result workflow. Check whether the explanation layer is placed below the table and how it supports the visible output.
Draxlr can add short AI summaries below result tables to help users understand SQL-backed outputs in plain English.
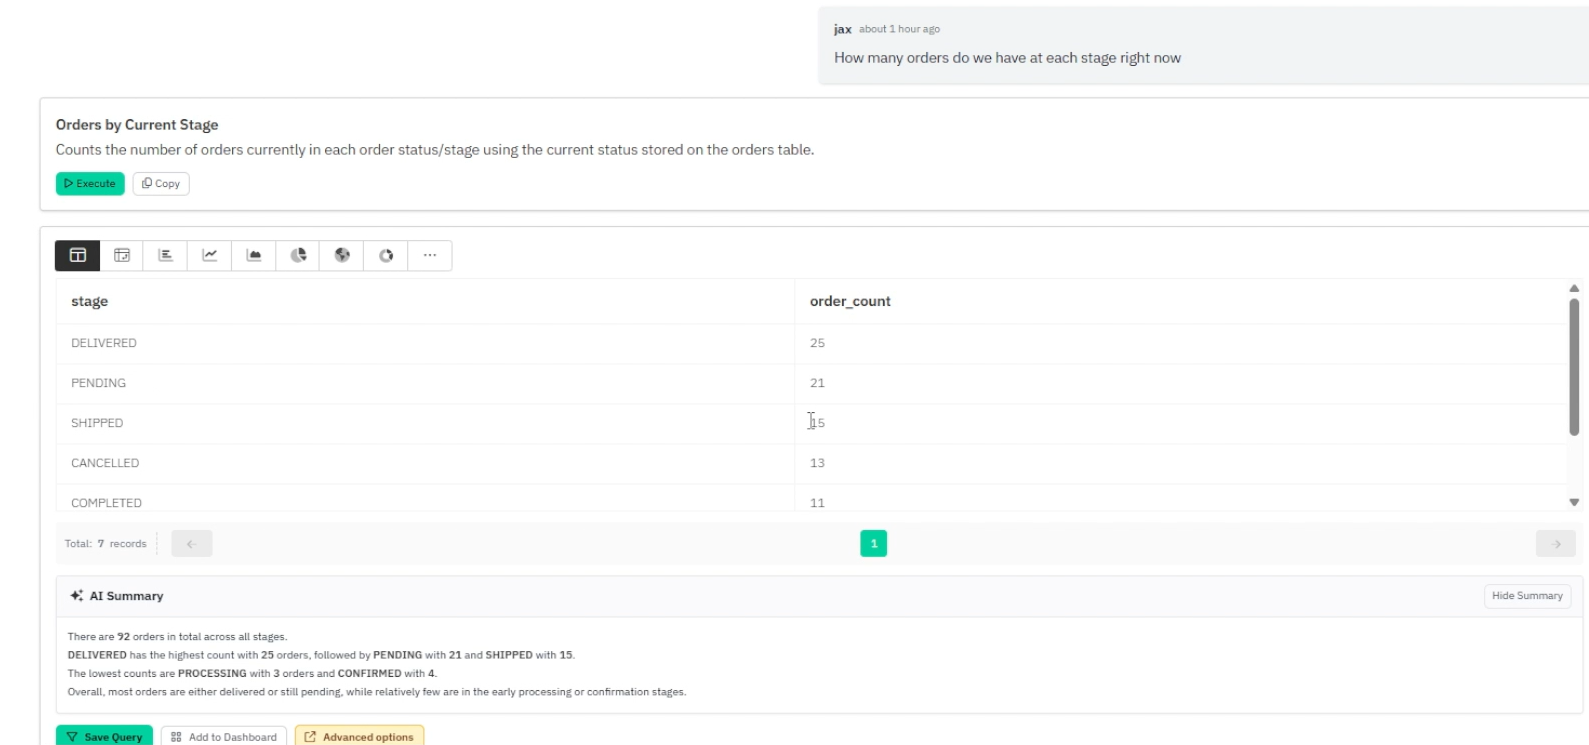
Draxlr returned the order stage table and generated an AI Summary. The summary explained the order distribution across stages, including delivered, pending, shipped, processing, and confirmed orders.
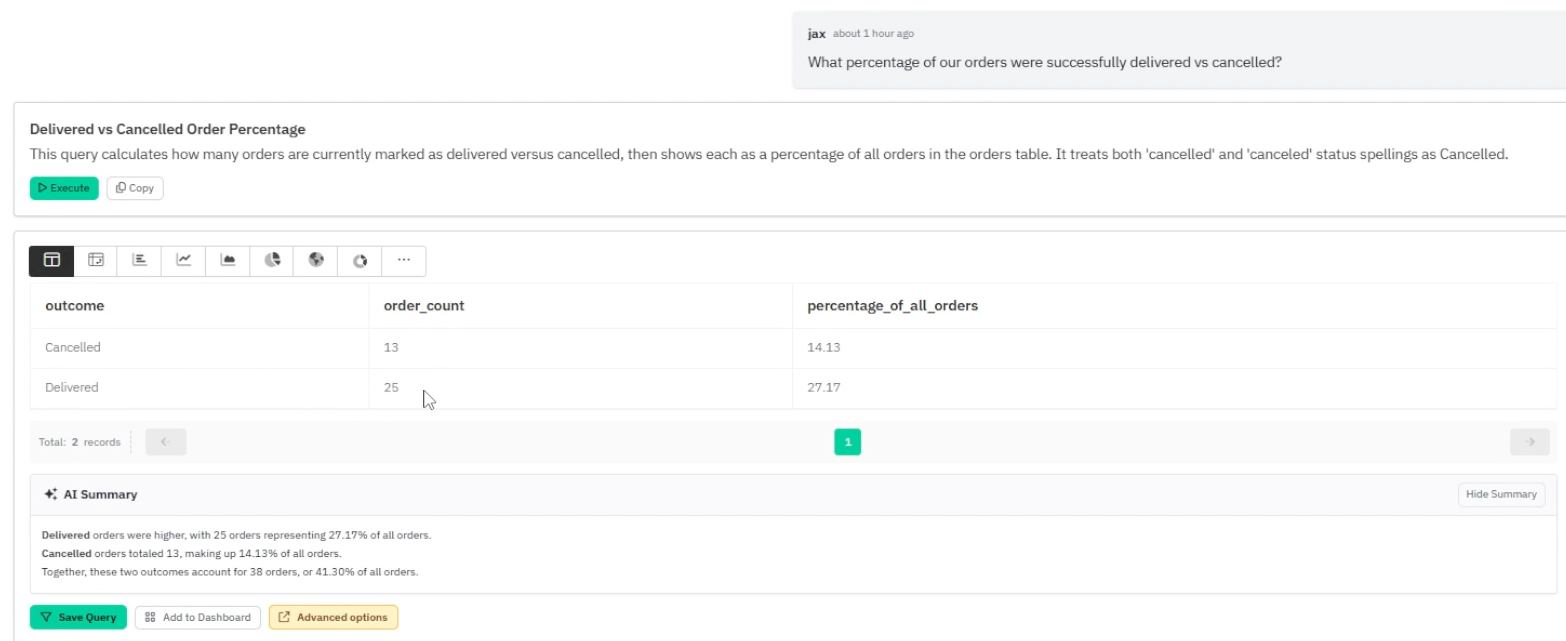
Draxlr returned the delivered vs cancelled percentage and generated a readable AI Summary. The summary highlighted the delivered and cancelled order percentages and explained the comparison in plain English.
CSV ExportStrong — Draxlr allows users to export generated result tables as CSV.8/10▾
Feature tested: CSV Export
Result: Passed (8/10)
Verdict: Strong — Draxlr allows users to export generated result tables as CSV.
Expected behavior: Draxlr lets users export SQL-backed query results as CSV, making the output reusable in spreadsheets, reports, or external workflows.
Test case: Text prompt → Image
Input type: Text prompt
Input used: Input artifact (Text prompt): Input
Observed output: Output artifact (Image): After generating the customer acquisition result table, Draxlr provided a CSV export option. This means the returned database result can be downloaded and reuse — draxlr-csv-export.png
Input artifact: Input artifact (Text prompt): Input
Output artifact: Output artifact (Image): After generating the customer acquisition result table, Draxlr provided a CSV export option. This means the returned database result can be downloaded and reuse — draxlr-csv-export.png
What changed: Text prompt transformed into Image
Why it matters / Conclusion: The screenshot is needed to confirm where the CSV export action appears. Check whether export is available directly from the generated result area.
Draxlr lets users export SQL-backed query results as CSV, making the output reusable in spreadsheets, reports, or external workflows.
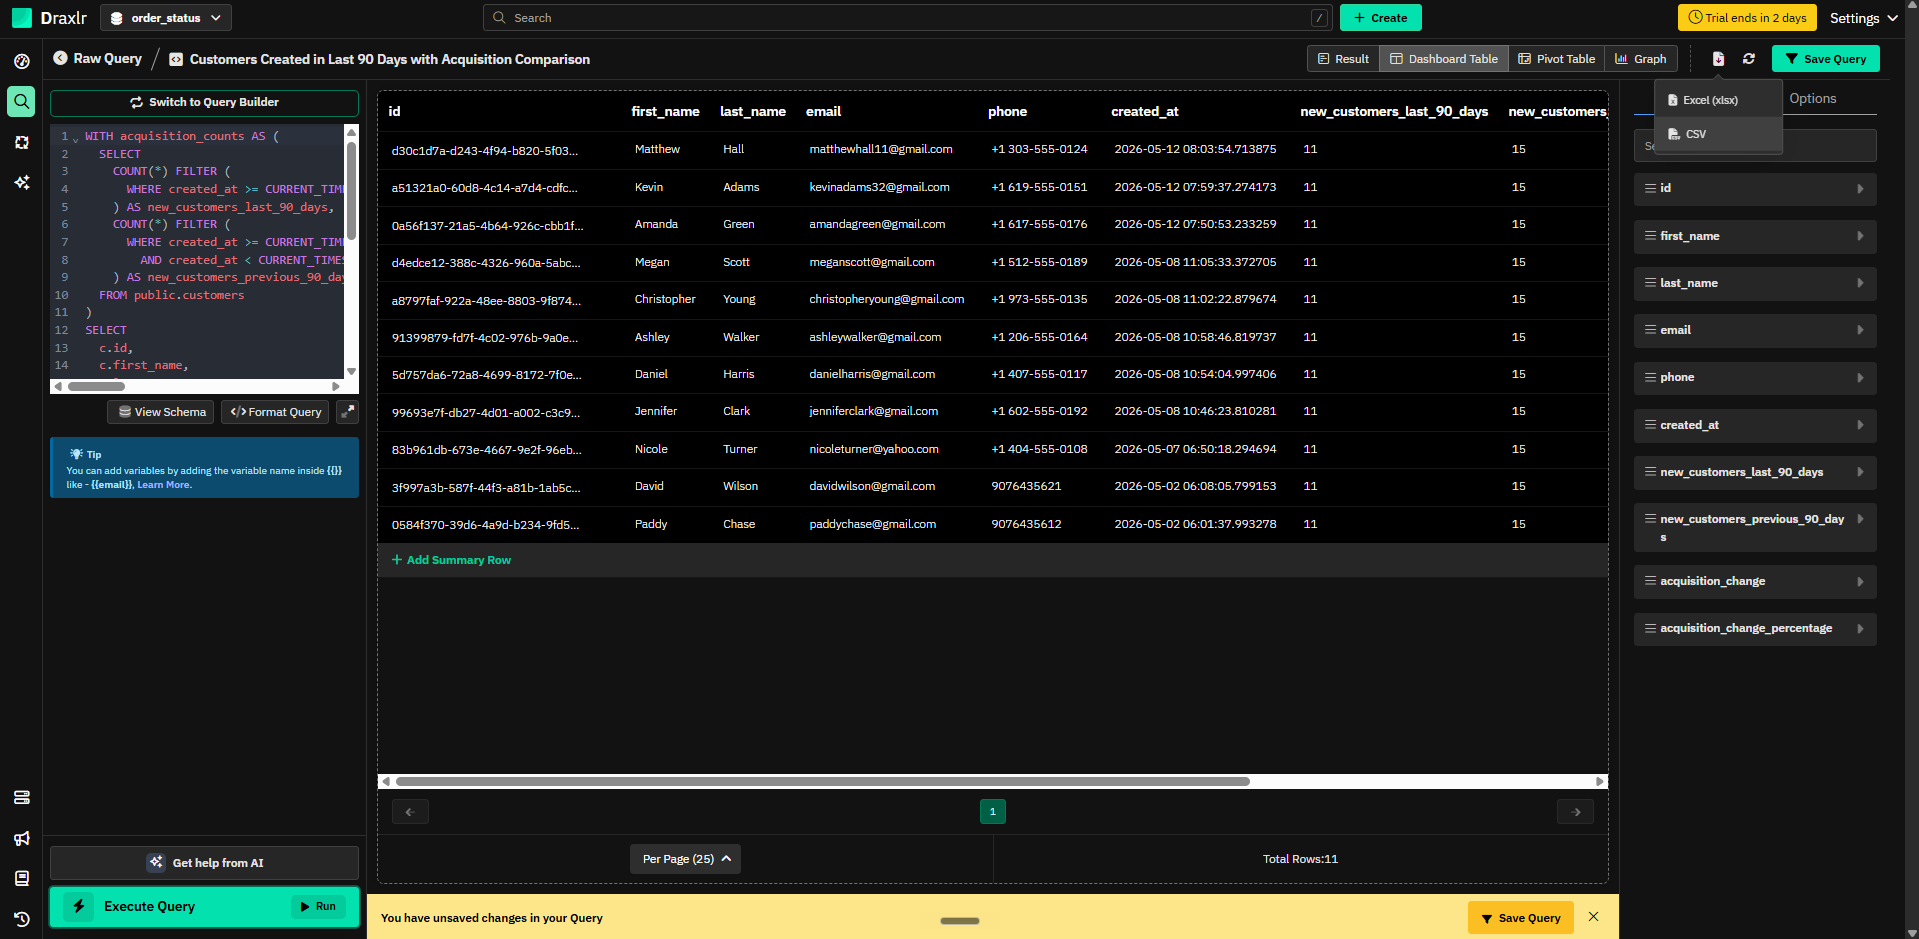
After generating the customer acquisition result table, Draxlr provided a CSV export option. This means the returned database result can be downloaded and reused outside Draxlr instead of staying only inside the tool interface.
Save QueryStrong — Draxlr allows users to save useful generated queries.8/10▾
Feature tested: Save Query
Result: Passed (8/10)
Verdict: Strong — Draxlr allows users to save useful generated queries.
Expected behavior: Draxlr lets users save generated queries so the same analysis can be reused later without asking the same database question again.
Test case: Text prompt → Image
Input type: Text prompt
Input used: Input artifact (Text prompt): Input
Observed output: Output artifact (Image): After generating the result, Draxlr showed a Save Query action around the result area. — draxlr-draxlr-save-query-modal-with-dashboard-toggle.png
Input artifact: Input artifact (Text prompt): Input
Output artifact: Output artifact (Image): After generating the result, Draxlr showed a Save Query action around the result area. — draxlr-draxlr-save-query-modal-with-dashboard-toggle.png
What changed: Text prompt transformed into Image
Why it matters / Conclusion: The screenshot is needed to verify the Save Query workflow. Check whether the modal allows a query name, folder selection, and dashboard toggle before saving.
Draxlr lets users save generated queries so the same analysis can be reused later without asking the same database question again.
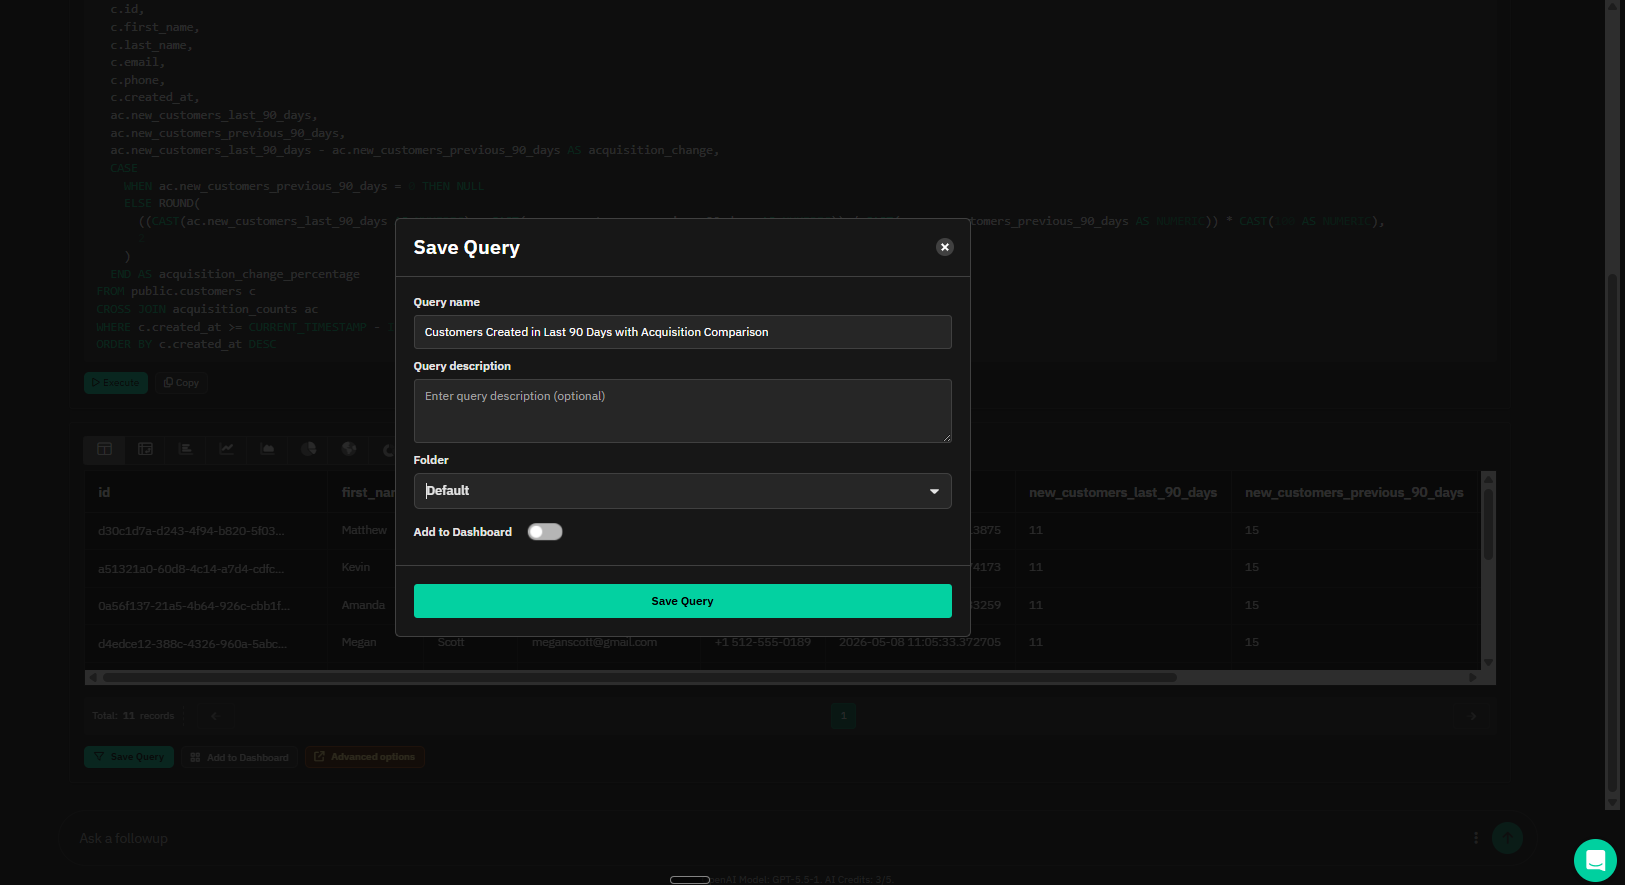
After generating the result, Draxlr showed a Save Query action around the result area.
Add to DashboardStrong — Draxlr allows generated outputs to be added to dashboards.8/10▾
Feature tested: Add to Dashboard
Result: Passed (8/10)
Verdict: Strong — Draxlr allows generated outputs to be added to dashboards.
Expected behavior: Draxlr lets users add generated query results to dashboards, making the output useful beyond a one-time chat/table result.
Test case: Text prompt → Image
Input type: Text prompt
Input used: Input artifact (Text prompt): Input
Observed output: Output artifact (Image): After generating the result, Draxlr showed an Add to Dashboard action around the result area. — draxlr-draxlr-add-to-dashboard-confirmation.png
Input artifact: Input artifact (Text prompt): Input
Output artifact: Output artifact (Image): After generating the result, Draxlr showed an Add to Dashboard action around the result area. — draxlr-draxlr-add-to-dashboard-confirmation.png
What changed: Text prompt transformed into Image
Why it matters / Conclusion: The screenshot is needed to confirm the dashboard action end-to-end. Check both the Add to Dashboard control and the success toast showing the result was added.
Draxlr lets users add generated query results to dashboards, making the output useful beyond a one-time chat/table result.
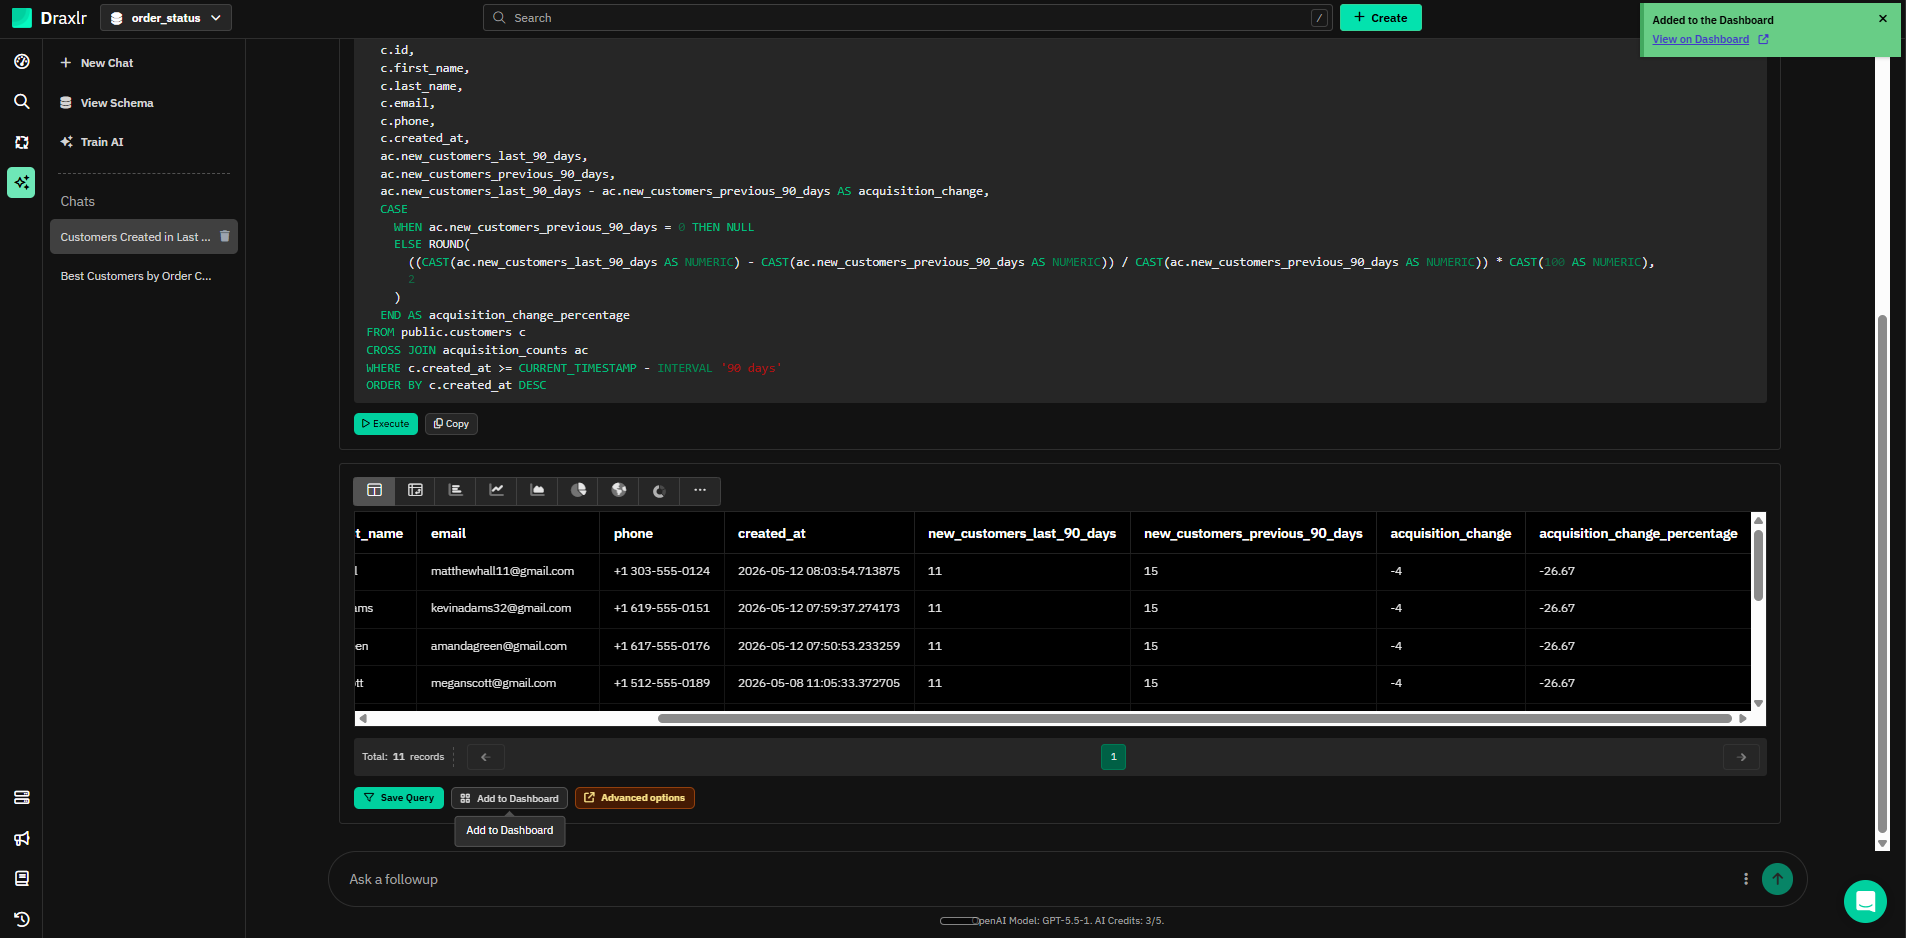
After generating the result, Draxlr showed an Add to Dashboard action around the result area.
Predictive business metric handlingWeak predictive business metric handling▾
Feature tested: Predictive business metric handling
Result: Failed
Verdict: Weak predictive business metric handling
Expected behavior: This is a real weak-case artifact because “likely to churn next month” is a predictive business question, not a direct SQL lookup. A stronger business analyst experience should either ask for a churn definition, explain the assumption more clearly, or avoid presenting the result like a confident prediction.
Test case: Text prompt → Image
Input type: Text prompt
Input used: Input artifact (Text prompt): Input
Observed output: Output artifact (Image): Draxlr generated a SQL-backed churn prediction even though the schema did not include an explicit churn label, churn model, or customer risk table. — draxlr-draxlr-churn-assumption-sql-caution.png
Input artifact: Input artifact (Text prompt): Input
Output artifact: Output artifact (Image): Draxlr generated a SQL-backed churn prediction even though the schema did not include an explicit churn label, churn model, or customer risk table. — draxlr-draxlr-churn-assumption-sql-caution.png
What changed: Text prompt transformed into Image
Test case: Text prompt → Image
Input type: Text prompt
Input used: Input artifact (Text prompt): Input
Observed output: Output artifact (Image): The tool explained that it was estimating churn from order behavior, but the output created very large churn risk scores and treated repeat-order timing as the — draxlr-draxlr-churn-risk-output-caution.png
Input artifact: Input artifact (Text prompt): Input
Output artifact: Output artifact (Image): The tool explained that it was estimating churn from order behavior, but the output created very large churn risk scores and treated repeat-order timing as the — draxlr-draxlr-churn-risk-output-caution.png
What changed: Text prompt transformed into Image
Why it matters / Conclusion: The screenshot is required to verify the weakness. The issue is only visible in the artifact: Draxlr turns an undefined predictive business question into a SQL result, and the generated `churn_risk_score` values need manual inspection before they can be trusted.
This is a real weak-case artifact because “likely to churn next month” is a predictive business question, not a direct SQL lookup. A stronger business analyst experience should either ask for a churn definition, explain the assumption more clearly, or avoid presenting the result like a confident prediction.
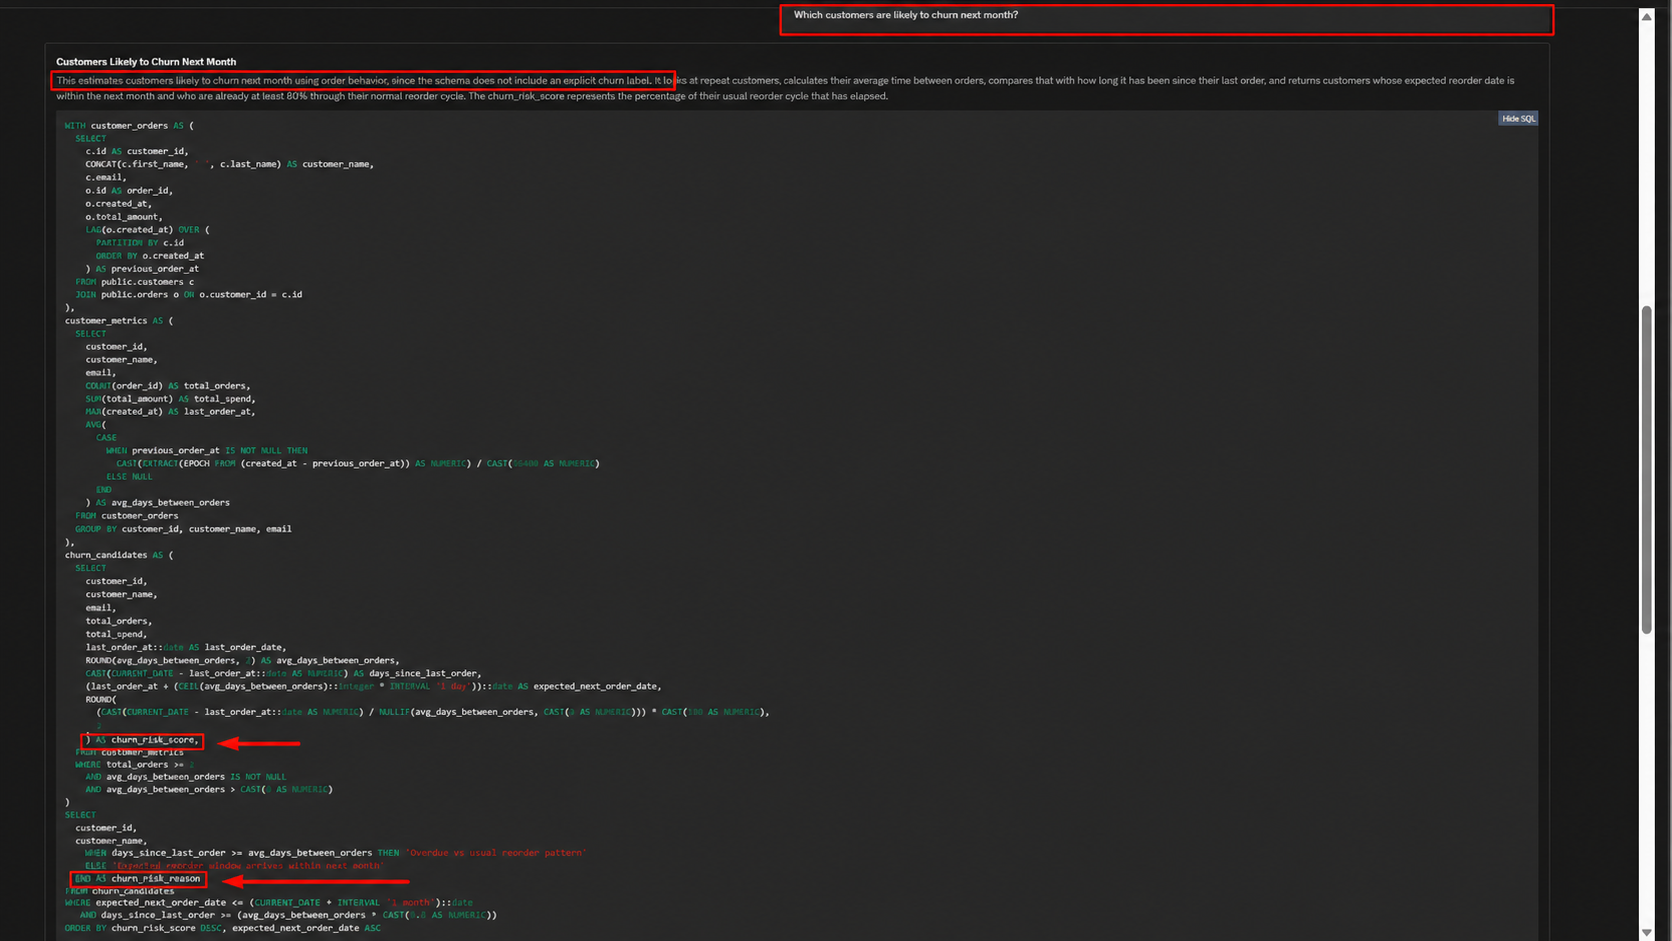
Draxlr generated a SQL-backed churn prediction even though the schema did not include an explicit churn label, churn model, or customer risk table.
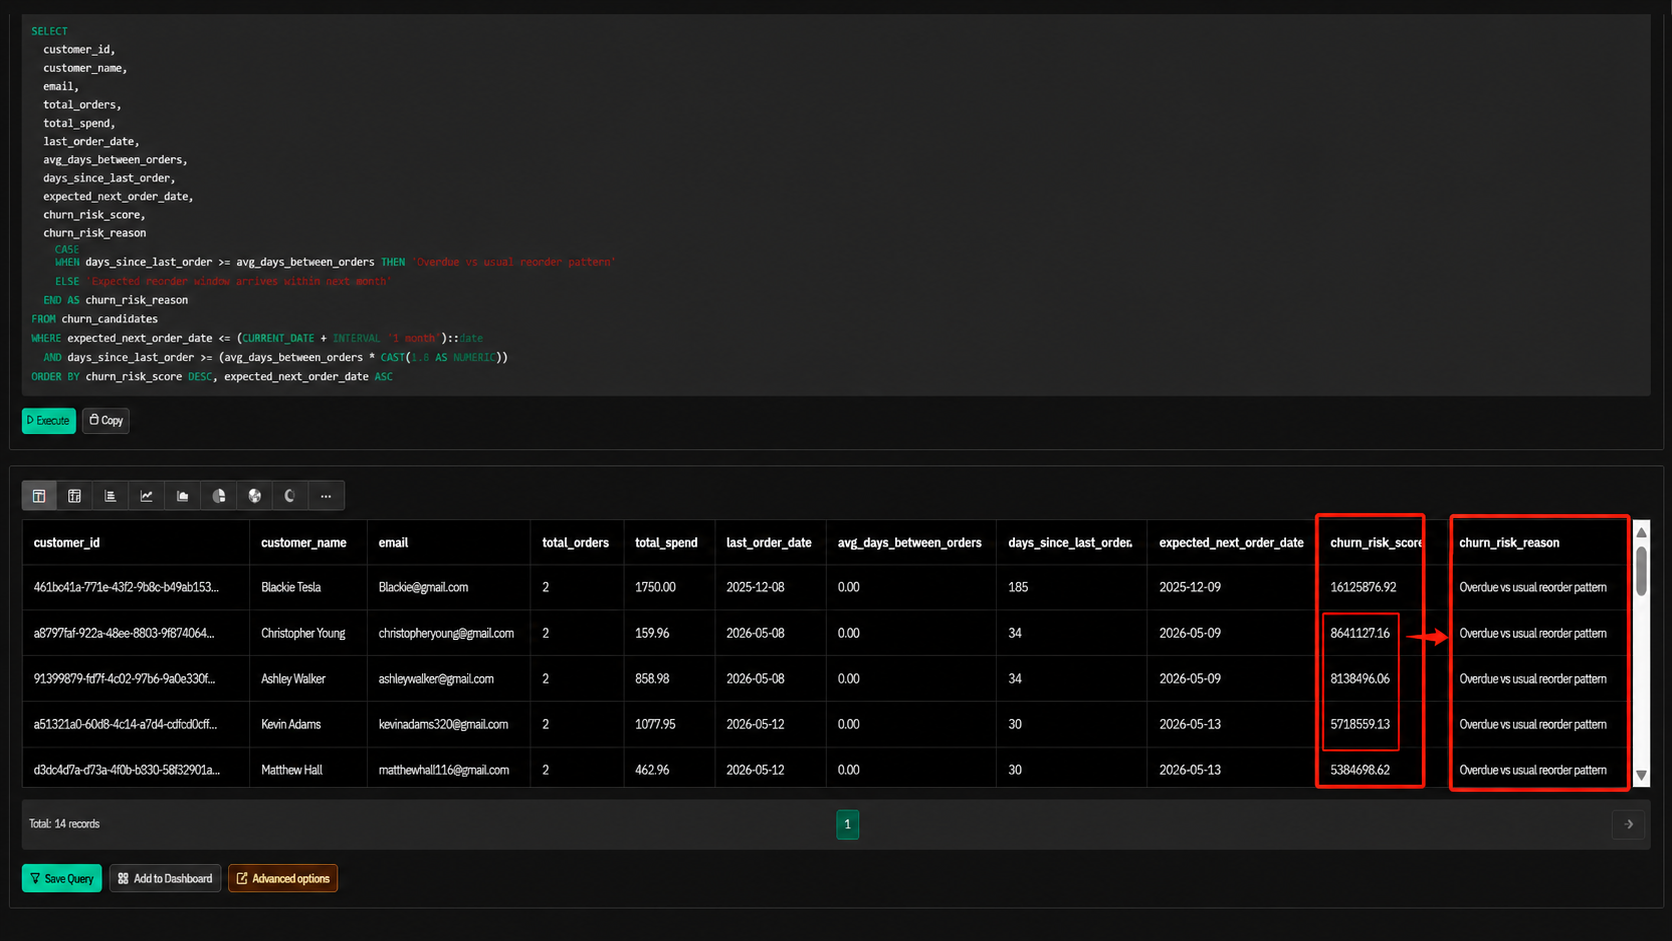
The tool explained that it was estimating churn from order behavior, but the output created very large churn risk scores and treated repeat-order timing as the churn signal.
Pricing & Access
Plans as of June 2026
Testing was completed on Draxlr’s 7-day free trial. Paid plan limits and production usage should be verified again before publishing.
Is This Right For You?
A side-by-side guide based on our hands-on testing.
Banner Preview
How the embed badge will look on your site

Embed HTML
Copy this code to your website source
Quick Integration Guide
- 1Copy the HTML code block above.
- 2Paste it into your site's HTML or CMS editor.
- 3Banner appears instantly on your page.
- 4Links back to your tool profile here.
Similar Tools
Discover more AI tools like Draxlr to enhance your workflow.