Segments a shield logo out of a single full-page raster scan and also retains Figure 1 as an image with an accurate synthesized caption; the returned logo crop is a tight 77x81px cut with legible shield text.
What was measured
Visual Content Retention
Retains charts, figures, diagrams, and images in the output and places them in the correct reading position.
decisive for this rankingtransformation
For complex PDFs, figures, charts, and images are part of the document content, so preserving them in the right place is part of the core job. (3 of 3 judges)
What was given, what came back
Test input: Scanned Research Paper · pdf · group: scanned-research-paper
Input — what we sent
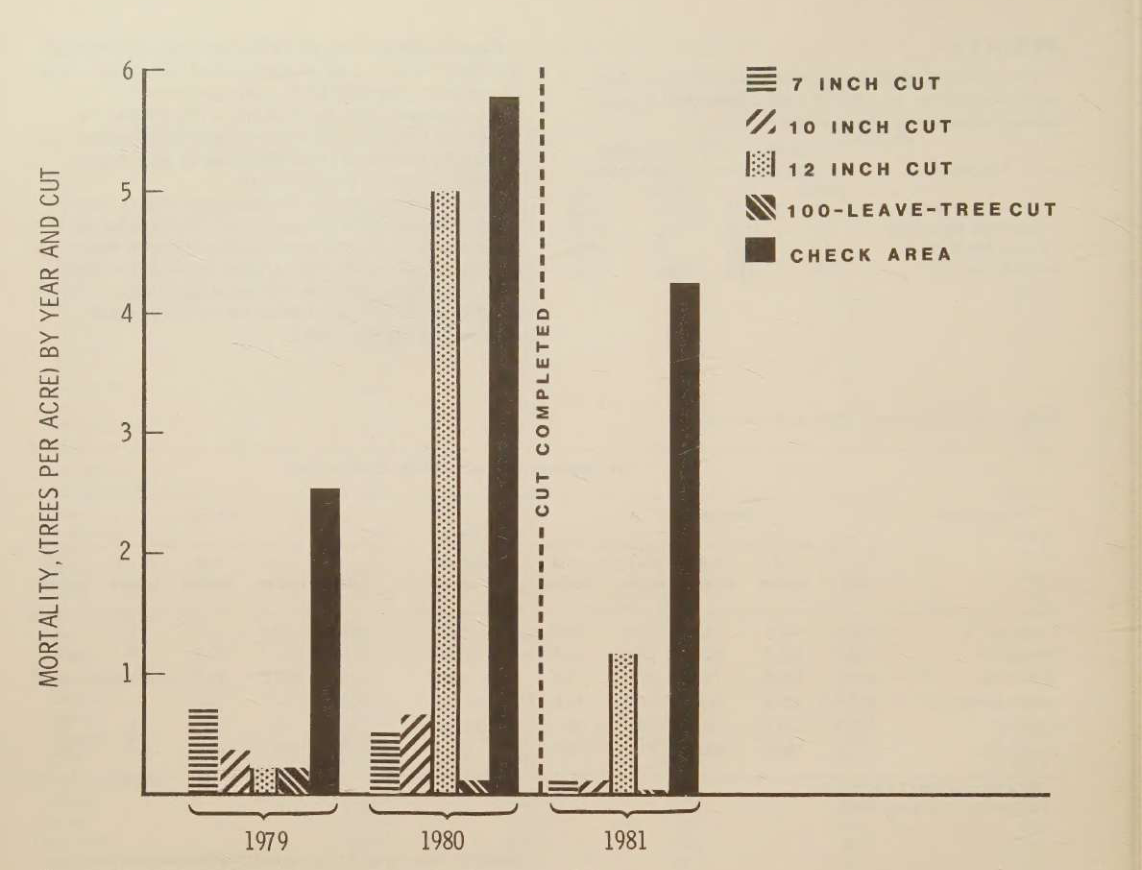

Scanned Research Paper
An image-only scanned research paper used to stress OCR and layout recovery in a multi-column academic document with figures, charts, tables, captions, and references.
Why this input is hard
- · OCR on scanned pages
- · Multi-column reading order
- · Figure and chart handling
- · Table reconstruction from scans
- · Caption association
- · Reference extraction
- · Overall document structure retention
Output — unretouched


Also checked on this input — same tool, 8 other criteria
Advanced Features✓ WorkedSchema-driven extract.run fully recovers the corrupted Table 4 rows, returning all 12 checked rows exactly, including the 10-inch-cut 1979 MPB row whose parse.run output was badly garbled.Advanced Features◐ MixedThe confidence signal flags the faint handwritten margin note and the garbled Table 4 as low confidence, but it misses the hallucinated 'USA' word in the title, which is still rated 0.9354 confident.Complex Document Handling⚠ StruggledHandles the 12-page scan in 10.6 seconds with no truncation, but the densest 17-column table has unreadable stretches with injected glyphs and run-on numbers.Markdown Quality✓ WorkedUses no invented tags or malformed markdown; the only HTML seen is legitimate <br /> inside table cells, so the syntax stays clean even though the document does not surface real heading markup.Reading Order & Structure⚠ StruggledDisplaces the byline by a full column: the author line that sits above the two-column split in the source is emitted only after the entire left column, and its footnote markers are rendered inconsistently.Table Preservation✗ FailedCatastrophically corrupts the dense 17-column Table 4, injecting non-Latin glyphs into numeric cells and producing run-on strings such as 238-563NT, 2231, and 8998 6 in the 10-inch and 12-inch blocks.Table Preservation◐ MixedPartially reconstructs Table 1: most of the roughly 90 numeric values are exact, but literal 0 values in the 12-inch column become blanks, one mean cell picks up stray digits (33.0 830000), and a row-label-only section header is broadcast across all six columns in one instance.Text & OCR Completeness✓ WorkedConverts all 12 scanned pages with no gaps; the page-11-to-page-12 handoff is preserved verbatim, and a separate page-marker output shows pages 1 through 12 present with no missing markers.
Provenance
- Observation
- ab812bbc-7ab3-4b0c-82e1-e142cb5375fe
- Evidence run
- 6e3160de-fe46-4b45-b071-72560b5c5d0e
- Study
- Convert a Complex PDF into Clean Markdown with an API
- Research task
- 86b9h7t37
- Tested at
- not recorded
- Source
- first-party
- Evidence state
- verified
- Proof shown
- input + output shown
- Cost / latency
- not captured
- Repeat run
- not captured
- Tester
- not captured
The last three rows are honest blanks, not placeholders — our capture has no field for them yet.
Query this
get_evidence({
  tool: "reducto",
  scenario: "scanned-research-paper"
})
MCP · mcp.aidemos.com/api/mcp
Free with attribution.
Same input, same check — 6 other tools
measured on Visual Content Retention
Adobe API✓ WorkedKeeps chart artwork embedded in the extracted page, placing the residual basal-area figure in situ beneath the extracted table text.Extend AI◐ MixedExtracts chart values into a captioned figure block, but the report says the mortality chart's trend visualization is not fully retained.Landing AI✗ FailedConverts a scanned bar chart into a textual transcription of legend items and approximate values instead of retaining the chart visually in the output.LlamaParse◐ MixedConverts a bar chart into a structured table, preserving the legend/value mapping but not keeping the chart as a visual chart.Mistral AI✓ WorkedCharts are exposed through both page-wise markdown files and the extracted visual assets, keeping the visual content linked to its original document location.Nutrient.io⚠ StruggledExtracts the Figure 3 chart's values, but the chart structure and layout are not preserved, so the visualization is flattened into text-like output.
This evidence is published in
Real inputs and real outputs, no retouching · every cell queryable via API & MCP · aidemos.com